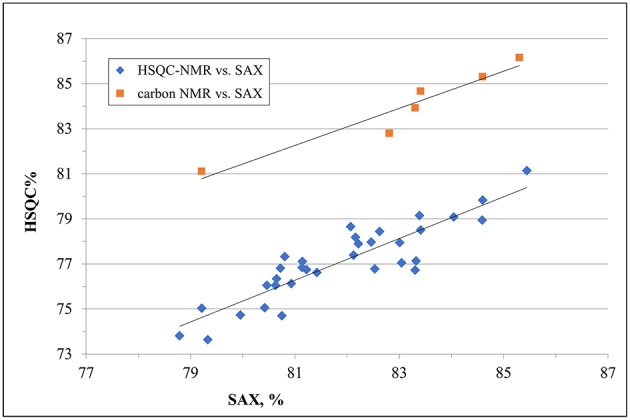
Figure 4.

Comparison of results for the content of glucosamine with a sulfate in position 6 (GlcNx,6S): results from SAX-HPLC vs. HSQC (blue dots) and 13C-NMR (red squares). The distribution of blue dots shows a clear correlation between the content of 6-sulfated glucosamine from the two methods, where results from the SAX method are always higher than those from the HSQC. Quantitative results from the carbon spectra of a sub-set of 6 heparin samples (red squares) show a much better agreement with SAX results, confirming a greater accuracy of the enzymatic method than the HSQC.
