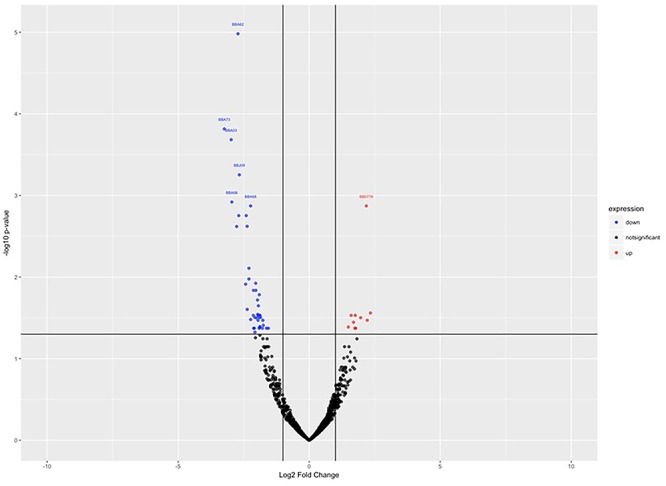
Figure 2.

Volcano plot, showing the statistically significant gene expression changes in control (untreated) versus treated samples. Log2 fold change is plotted on the x-axis, and p-value (significance) on the y-axis, where the up-regulated genes are shown in red (right) and the down-regulated genes are shown in blue (left).
