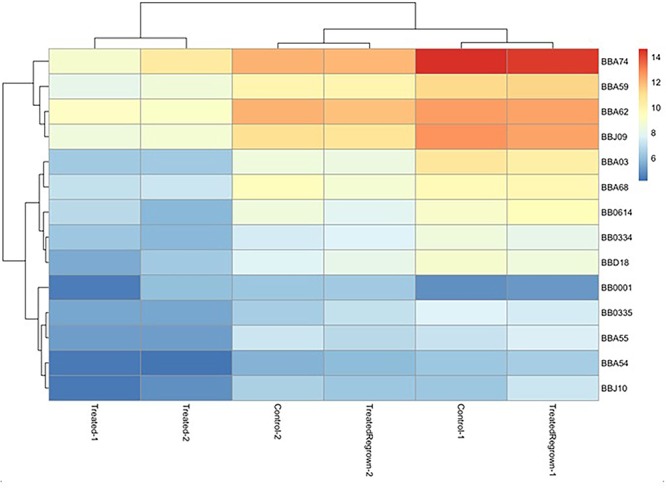
Figure 3.

Heat map, indicating the most significantly different gene expression among groups. Relatedness among gene expression resulted in the pairing of treated group replicates together and untreated/treated regrown replicates together, where red is up-regulated and blue is down-regulated. Only the most significantly affected gene differences are shown, for simplicity.
