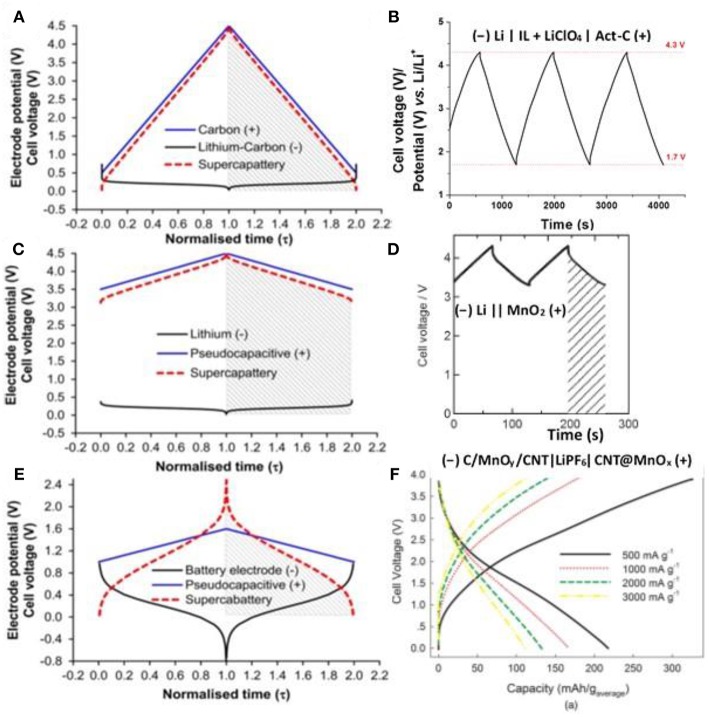
Figure 6.
Calculated electrode potential (black and blue lines for negatrode and positrode) and cell voltage (red dashed lines) as a function of normalized time for galvanostatic charging and discharging (GCD) of three types of hypothetical supercapattery and the GCD plots of the related experimental demonstration of supercapatteries. (A) a hypothetical supercapattery with a negatrode of lithium metal or lithiated carbon and a positive positrode of activated carbon; (B) an experimental demonstration of (A) (–) Li | IL + LiClO4 | Act-C (+) (Yu and Chen, 2016a); (C) a hypothetical supercapattery with a negatrode of lithium metal or lithiated carbon and a pseudocapacitive positrode; (D) an experimental demonstration of (C) (–) Li | PEO-LiTFSI | LTAP | 1.0 M LiCl aq. | MnO2 (+) (Makino et al., 2012) (Reprinted with permission from the Royal Society of Chemistry. Copy right 2012); (E) a hypothetical supercapattery with a negatrode of the typical battery type and a pseudocapacitive positrode; and (F) an experimental demonstration of (E) (–) C/MnOy/CNT | LiPF6 | CNT@MnOx (+) (Zhou et al., 2016) (Reprinted with permission from the Electrochemical Society. Copyright 2016). (A), (C) and (E) are adapted from the reference (Chen, 2017).

