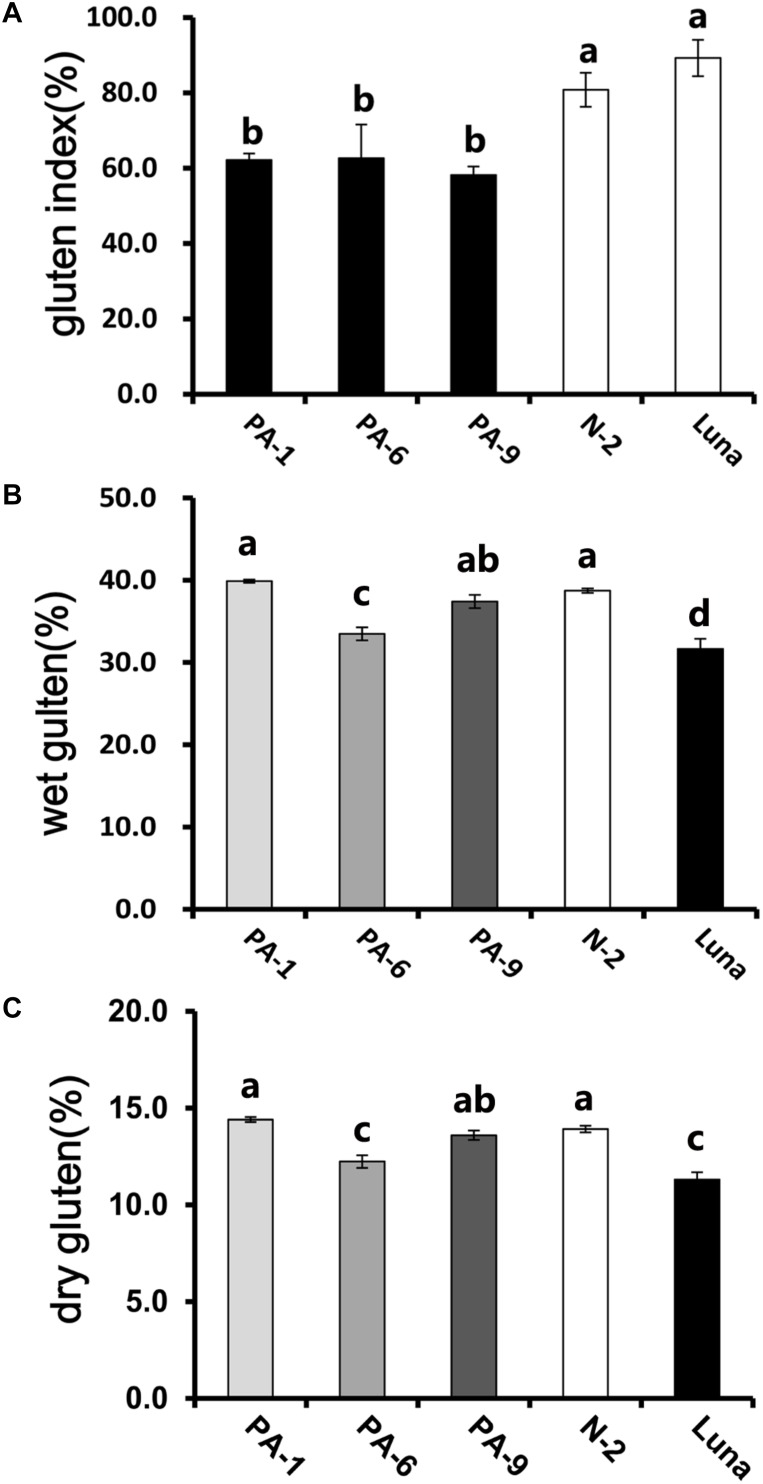
FIGURE 1.
Determination of gluten index of transgenic and control lines. (A) The wet gluten (B) dry gluten content, and (C) gluten index of transgenic and control lines. Data are given as mean ± SEM, calculated from three replicates. Values within the column followed by different letters indicate significant difference (P < 0.05).

