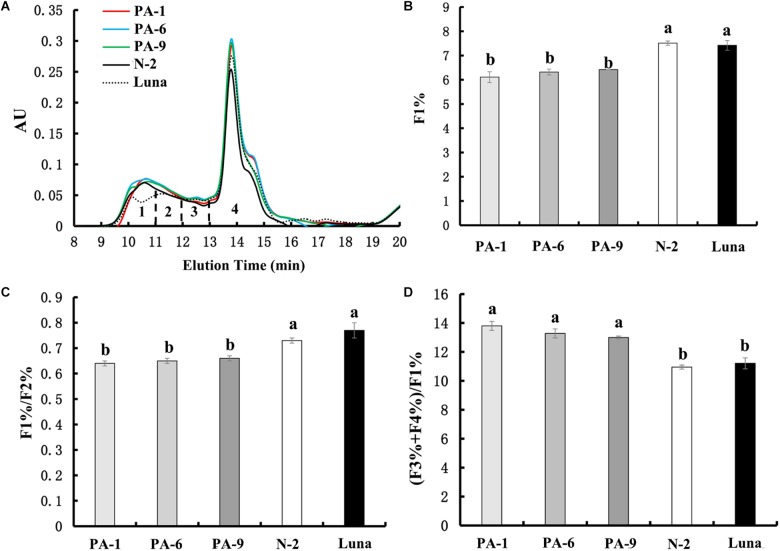
FIGURE 4.
Effect of PINA on the formation of gluten aggregates. (A) SE-HPLC analyses of flour samples from the transgenic and control lines. (B–D) Comparisons of the three SE-HPLC parameters F1%, F1/F2%, and (F3+F4%)/F1% between transgenic and control lines, which are related to gluten strength and baking quality. Data are given as mean ± SEM from three replicates. Different letters on the columns within the same SE-HPLC parameters indicate significant difference (P < 0.05).

