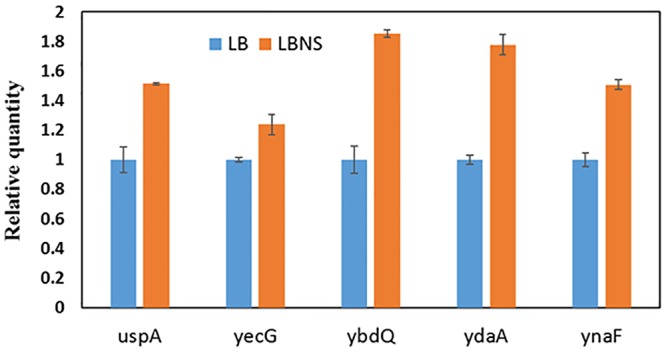
Figure 6.

Relative quantification of gene expression in STm cells grown in LBNS (orange columns) compared to growth in LB broth (Blue columns) at 37°C. Gene expression was normalized to the expression of rpoD under the same growth conditions. Bars represent the standard deviation of three repeats. Each of the tested genes was significantly (P < 0.05) induced upon growth in LBNS compared to LB, according to unpaired Student’s t-test.
