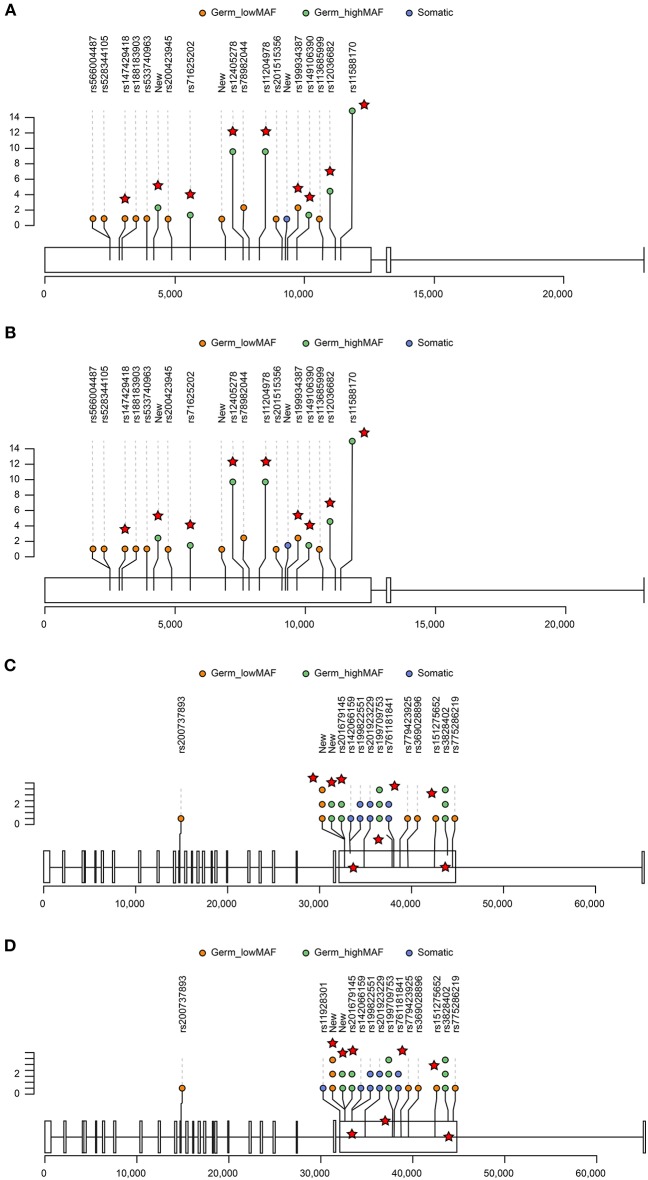
Figure 4.
Lolliplots showing the distribution of germline and somatic variants in the top two genes, FLG (A,B) and MUC4 (C,D). For those germline variants that had >0.01 Chinese MAF, only those variants that were predicted to be deleterious by PROVEAN or damaging by SIFT are displayed (red star). The X-axis represents the exon and chromosome location. The Y-axis represents the occurrence of variants in GGNs (somatic) or patients (germline). The distribution of variants in AAH GGNs (upper panel) (A,C) was compared with that in other GGNs (bottom panel) (B,D).

