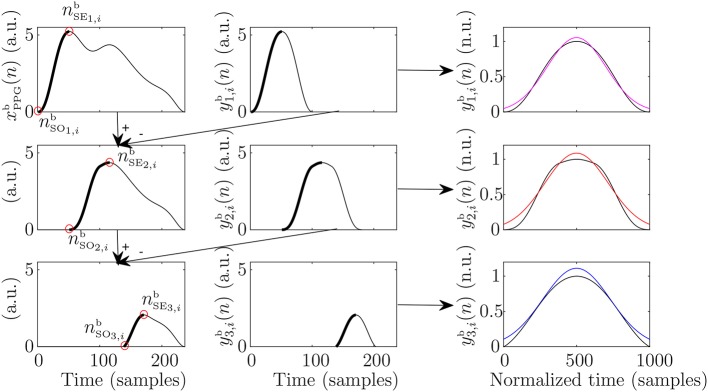
Figure 2.
Example of the steps for the pulse decompostion analysis that lead to extraction of main wave (first row), first reflected wave (second row), and second reflected wave (third row). In addition, the subsequent modeling of the extracted waves can be observed in the third column in magenta, red, and blue for the main, first reflected, and second reflected waves, respectively.

