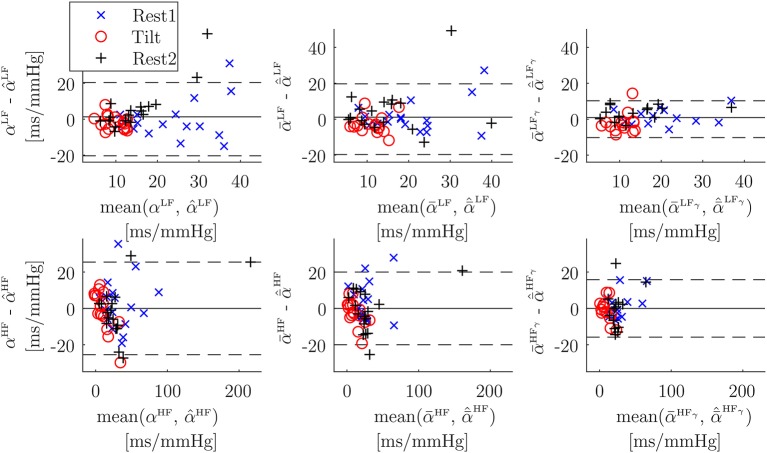
Figure 7.
Bland-Altman plots of α vs. its multiple-linear-regression-based combination of surrogates (Welch-periodogram approach, first column), of vs. its multiple-linear-regression-based combination of surrogates (time-frequency approach, second column), and of vs. its multiple-linear-regression-based combination of surrogates (time-frequency coherence approach, third column). Note that scales are not the same for LF band (first row) than for HF band (second row).

