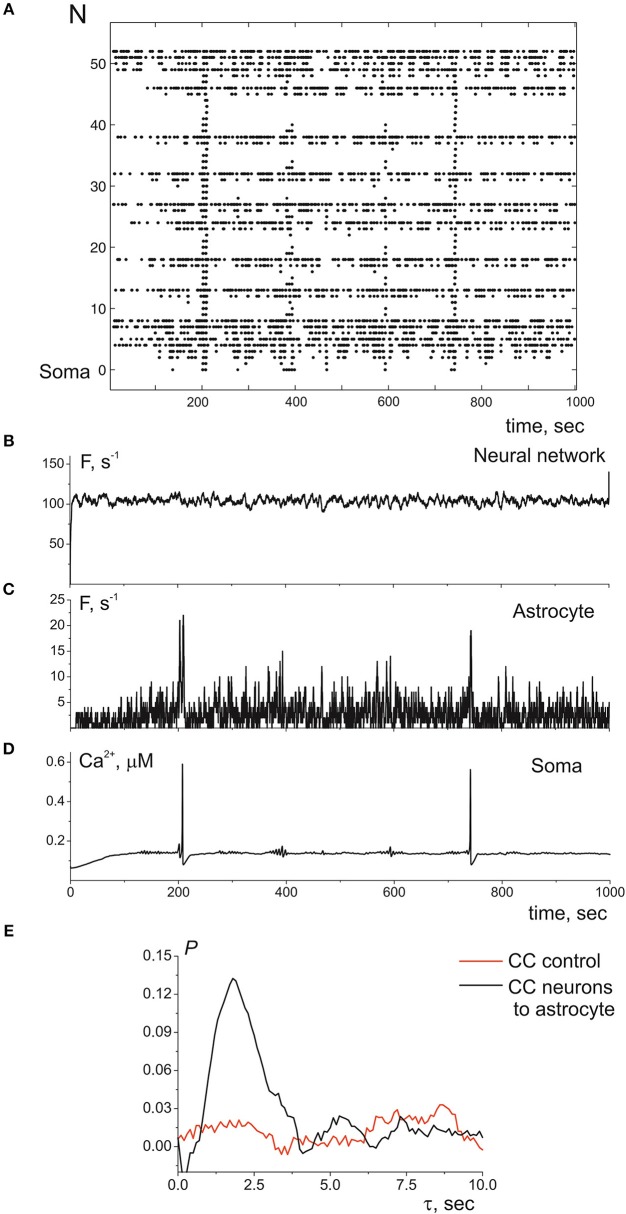
Figure 4.
(A) A raster plot of the calcium activity in astrocyte, where each dot represents a calcium signal (increase of Ca2+ concentration in compartment above threshold in 0.15 μM). (B) The neuronal firing rate, i.e., the number of spikes in the presynaptic neurons in the 100-ms time window. (C) The calcium firing rate in astrocyte, the number of Ca2+ signals in the 100-ms time window. (D) The time realization of Ca2+ concentration in soma. (E) The cross correlation between (B,C)—black line. The cross correlation between (C) and firing rate of all neuronal network—red line. λ = 9.3 Hz.

