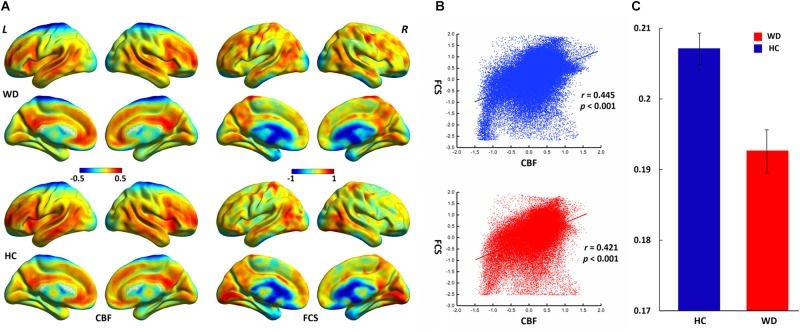
FIGURE 1.
Spatial distribution and neurovascular coupling in CBF and FCS. (A) Spatial distribution maps of CBF and FCS. (B) The whole-brain CBF–FCS coupling changes across voxel in the WD. (C) The whole-brain CBF–FCS coupling changes across subject in the WD. The FCS and CBF maps are normalized to z scores and averaged across subjects within groups. L, left; R, right. The right picture is whole gray matter (GM) level CBF–FCS coupling changes in WD. Scatter plots of the mean GM level spatial correlations across voxels between CBF and FCS in HC (blue) and WD (red), respectively. The mean CBF–FCS correlation across subjects in WD and HC. CBF, cerebral blood flow; FCS, functional connectivity strength; HC, healthy controls; WD, Wilson’s disease.

