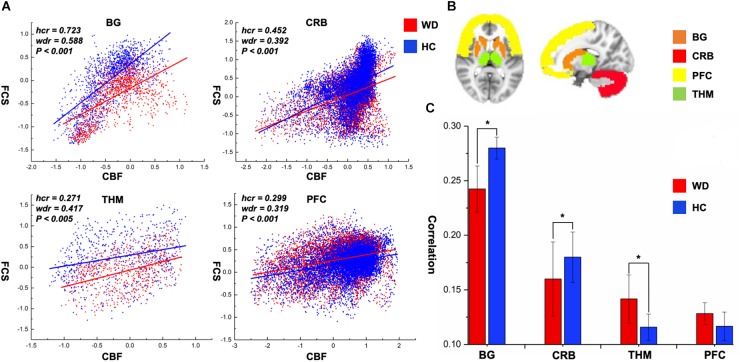
FIGURE 4.
CBF–FCS coupling changes of WD in basal ganglia, cerebellum, thalamus, and prefrontal cortex. (A) Scatter plots of mean GM level spatial correlations across voxels between CBF and FCS in HC (blue) and WD (red), respectively. (B) The GM regions of BG, CRB, THM, and PFC were extracted from AAL template. (C) The bar graph means CBF–FCS correlation across subjects in HC and WD. ∗Significant differences between both groups (P < 0.05). BG, basal ganglia; CRB, cerebellum; THM, thalamus; PFC, prefrontal cortex; hcr, the relationship between FCS and CBF in healthy controls; wdr, the relationship between FCS and CBF in patients with Wilson’s disease.

