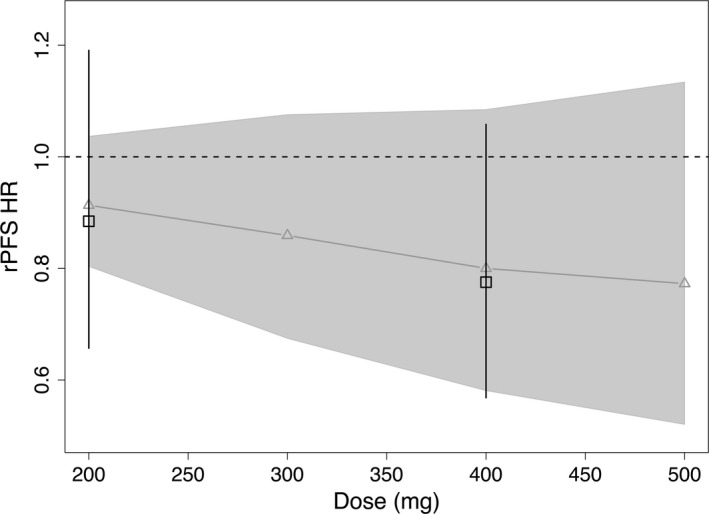
Figure 1.

Dose‐response projections of rPFS HR based on exposure–rPFS model and rPFS dose‐intensity model. Black squares and error bars are the observed rPFS HR and 90% confidence interval. Gray curves (and triangles) and shaded area are the model‐predicted rPFS HR and 90% confidence interval. HR, hazard ratio; rPFS, radiographic progression‐free survival.
