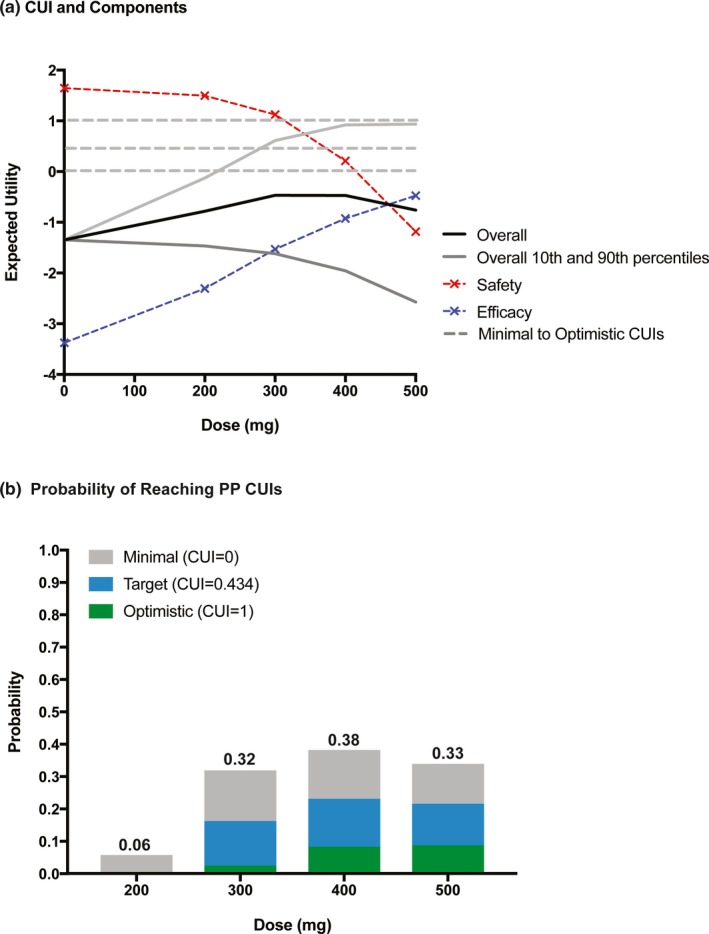
Figure 4.

CUI distribution (a) and probabilities of reaching PPs (b) vs. dose using scenario 2 (details in Table 1) as an example. CUI, clinical utility index; PP, product profiles.

CUI distribution (a) and probabilities of reaching PPs (b) vs. dose using scenario 2 (details in Table 1) as an example. CUI, clinical utility index; PP, product profiles.