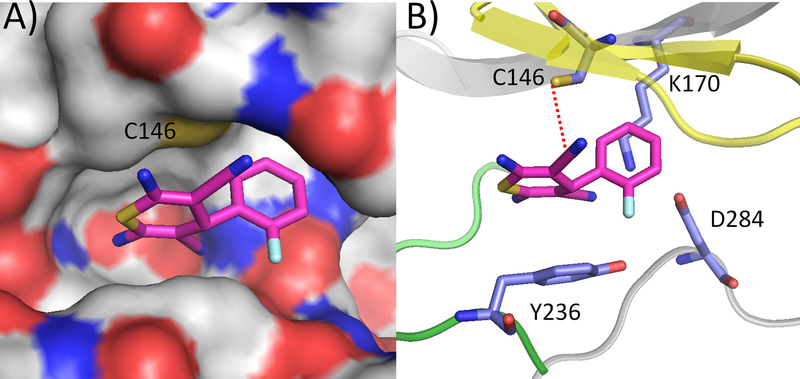
Figure 5.
Molecular docking of ligand DFTD onto the active site of the eEF-2K homology model. A) Surface representation and B) Ribbon diagram representation. The distance from the carbon atom of the nitrile group of the compound to the possible nucleophilic residues are as follows: Cys 146, 4.5 Å; Lys 170, 3.5 Å; Asp 284, 4.9 Å; Tyr 236, 3.9 Å. Yellow represents the G-loop region, whereas the green represents the hinge region.

