Figure 1.
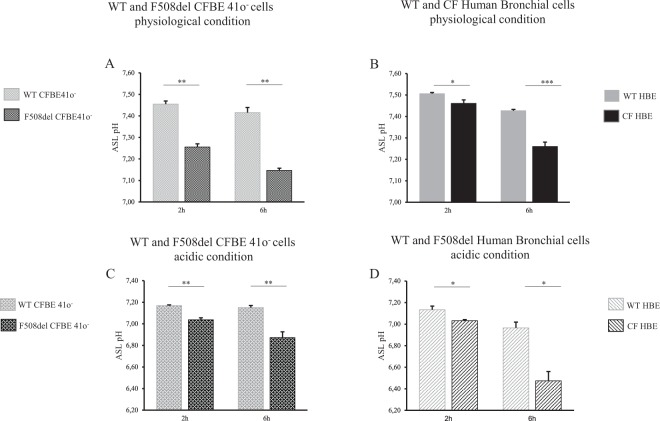
Airway surface liquid pH measurements under physiological and normocapnic acidosis conditions in WT and F508del bronchial epithelia at 2 and 6 hours. Apical fluid pH was measured after apical addition for 2 hours or 6 hours of 50 µL of physiologic Ringer’s solution (25 mM HCO3−, 5% CO2) (upper panel) or acidic Ringer’s (10 mM HCO3−, 5% CO2) (lower panel). (A) WT vs. F508del CFBE41o− cells. 2 h: pH = 7.45 ± 0.01 vs. pH = 7.26 ± 0.01, p = 0.008; 6 h: pH = 7.42 ± 0.02 vs. pH = 7.15 ± 0.01, p = 0.008. (B) WT vs. CF Human Bronchial Epithelial (HBE) primary cells. 2 h: pH = 7.51 ± 0.004 vs. pH = 7.46 ± 0.02, p = 0.036; 6 h: pH = 7.43 ± 0.006 vs. pH = 7.26 ± 0.02, p < 0.001. (C) WT vs. F508del CFBE41o− cells. 2 h: pH = 7.17 ± 0.01 vs. pH = 7.04 ± 0.02, p = 0.008; 6 h: pH = 7.15 ± 0.02 vs. pH = 6.87 ± 0.05, p = 0.008. (D) WT vs. F508del HBE primary cells. 2 h: pH = 7.13 ± 0.03 vs. pH = 7.03 ± 0.01, p = 0.028; 6 h: pH = 6.97 ± 0.05 vs. pH = 6.47 ± 0.09, p = 0.028. For all conditions, n = 3 in triplicate except for figure B where CF bronchial primary cells were derived from 3 F508del homozygote donors (triplicate for each patient) and 1 N1303K/4005 + 1G > A patient (12 filters). Data are presented as mean ± SEM. Statistical significance from unpaired nonparametric Wilcoxon test. *p < 0.05; **p < 0.01; ***p < 0.001; NS: non significant.

