Figure 1.

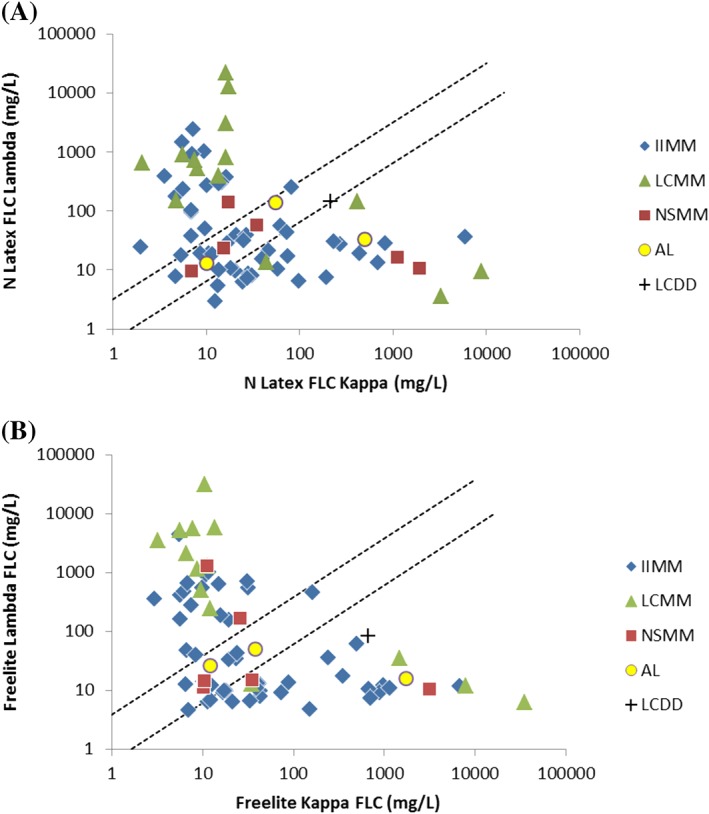
Kappa and lambda distribution scatter diagram for A, N Latex FLC assays and B, Freelite assays. Dotted lines indicate reference ranges

Kappa and lambda distribution scatter diagram for A, N Latex FLC assays and B, Freelite assays. Dotted lines indicate reference ranges