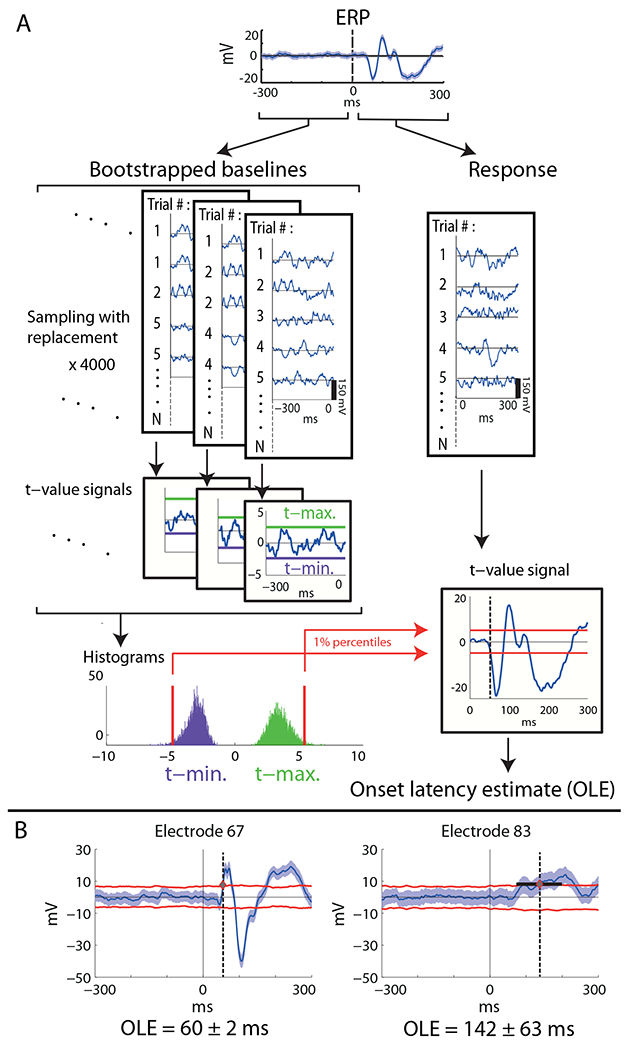
Fig. 1. Illustration of the onset latency estimation method.

A Calculation of onset latency estimate (OLE) for a specific electrode via bootstrapping over the baseline trials, construction of empirical distributions of maximal and minimal t-values, and using the 0.01 percentile values as thresholds for the response t-value signal (see methods). B. Estimation of temporal error of the OLE. Examples of specific electrodes having small or large temporal errors (left and right, respectively). Shaded blue area is 99% confidence interval around the mean. Red lines are the translation of the constant t-value thresholds back to the voltage domain, multiplying by the instantaneous standard error (see methods for detailed explanation). Electrode numbers are specified in Fig. 2.
