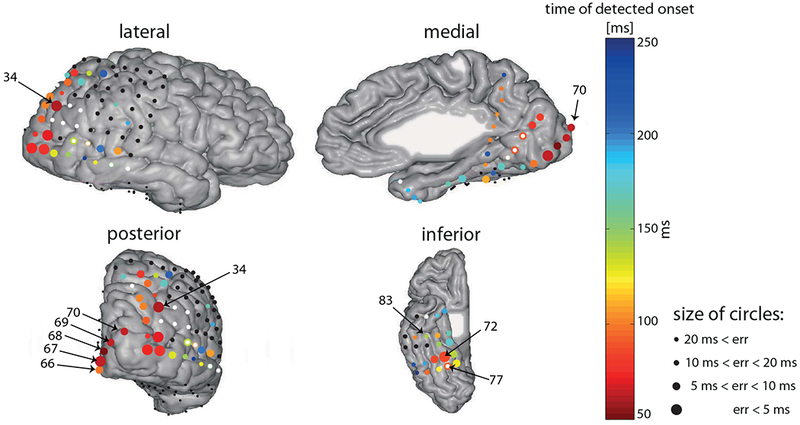
Fig. 2. Significant visual onset latencies in all electrodes.

Four views of the same brain are presented. The color of the circles denotes the timing of the estimated onset (see color bar). The size of the circles denotes the temporal error estimate (see methods): larger circles indicate more reliable estimates (smaller temporal errors; see legend). White dots indicate electrodes that were labeled as epileptic or with other electric artifacts. However, we looked for onset latencies of the bad electrodes as well, and if a significant onset was found, the colored circle was placed under the white dot (e.g. electrode 78). Black dots indicate electrodes for which no significant onset was detected. Numbers are indicated here for specific characteristic electrodes, and electrodes that are referred to in the text. Note that some electrodes appear in more than one view, however their onsets and/or numbers might appear in some of the views, e.g., the onsets of inferior electrodes are not indicated in the posterior view. Reference: common average (CAR). Electrodes that are explicitly mentioned in the text are labeled on the posterior and inferior views. For a dynamic depiction of activation over time see supporting information video S1.
