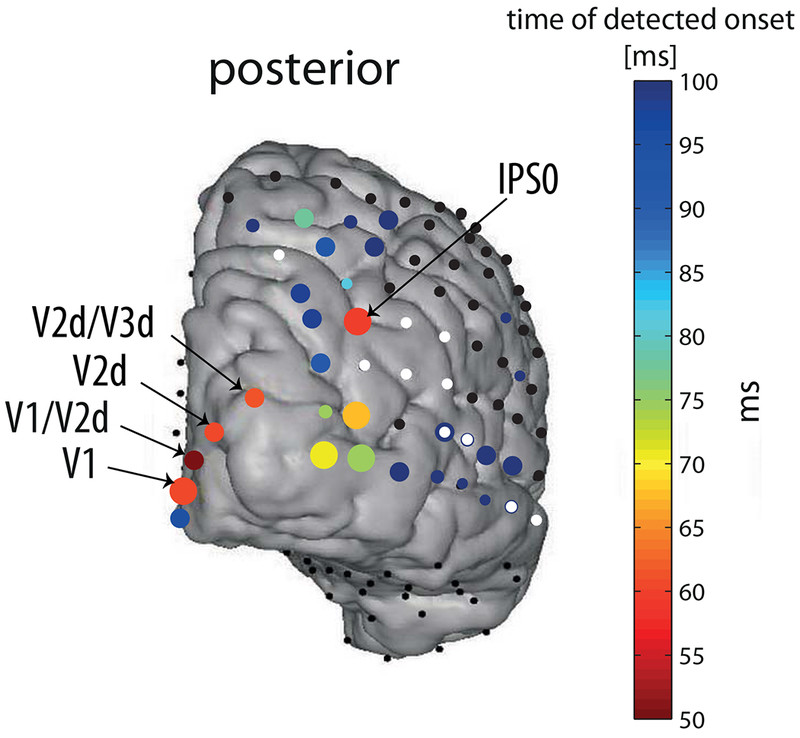
Fig. 3. Posterior view of early onset latency estimates.

The same as in figure 2, but with magnified temporal-scale, see color bar. Note that onset latencies estimated later than 100 ms are colored with the darkest blue on the scale. Labels according to retinotopic mapping as in figure 5 (see methods). Size of the circles is due to temporal error estimate, as in figure 2.
