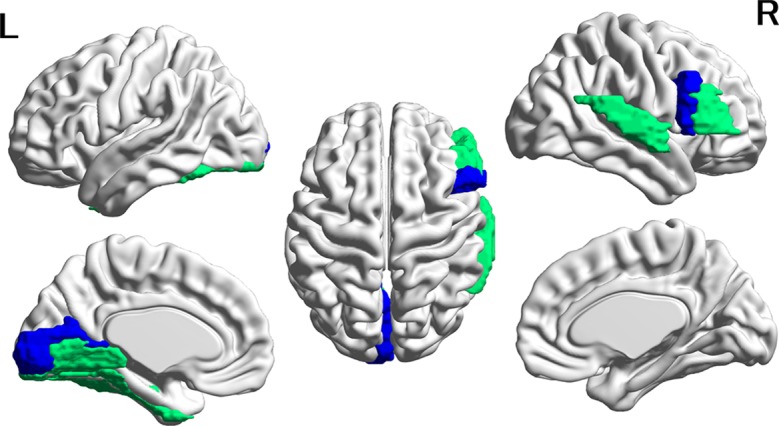
Figure 2.

Cortical regions with hypoconnectivity with the amygdala in autism. Six cortical regions in which connectivity with the amygdala was significantly greater for the CTL group than for the ASD group after FDR correction were mapped on the surface of the template brain. Colored regions correspond to the regions listed in Table 2 . The colors of the regions indicate levels of FDR adjusted p-value—green: 0.02 < p < 0.03; blue: 0.03 < p < 0.04. The figure was created using BrainNet Viewer.
