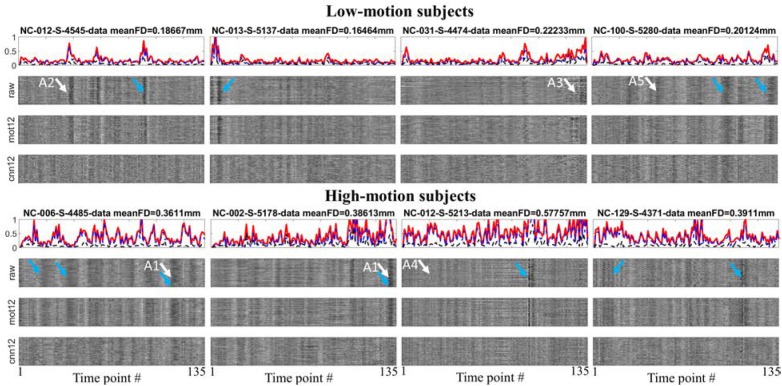
FIGURE 2.
Time-dependent whole brain motion measurements and different preprocessed time series within the GM mask for 4 low-motion and 4 high-motion subjects. White arrows are used to point effects of motion on fMRI signal. Blue arrows are used to point out the performance difference between cnn12 and mot12. The motion measurements include FD (red), sum of absolute translational parameters (blue) and sum of absolute rotational parameters (black).

