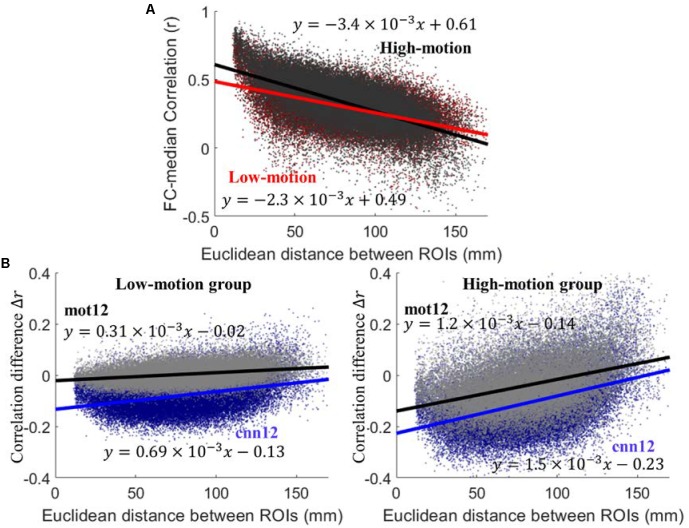
FIGURE 3.
(A) Plots of functional connectivity versus Euclidean distance between ROIs using raw data. (B) Plots of functional connectivity versus Euclidean distance for low- and high-motion groups. Pearson correlation coefficient r is used to calculate functional connectivity and Δr is defined as Δr = r(after motion regression) - r(before motion regression).

