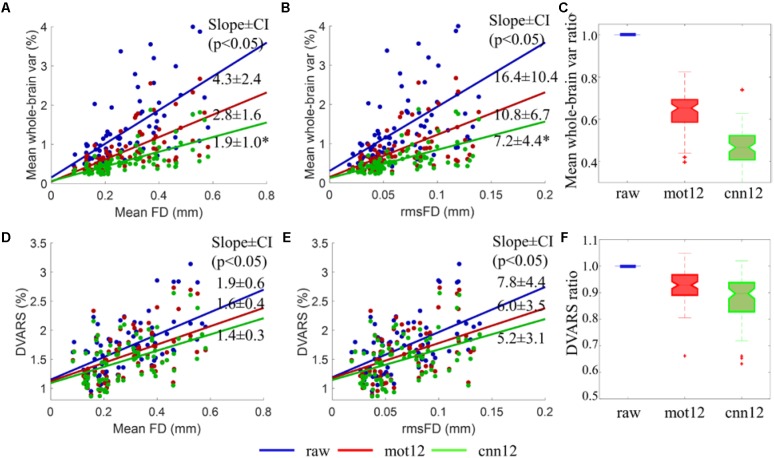
FIGURE 6.
Comparison of different motion regressors using mean whole-brain variance and DVARS of intensity-normalized BOLD signal. (A,B,D,E) Scatter plots of fMRI data derived measurements (mean whole-brain variance and DVARS) versus quality control measurements (mean FD and rmsFD). The mean whole-brain variance is computed by first converting fMRI time series to percent signal change and then calculating the mean of the variance of all voxels time series across the entire brain. (C,F) Boxplots of the ratio of mean whole-brain variance and DVARS. The ratios of mean whole-brain variance and DVARS are defined as the ratio of the measurements after motion regression over the value before motion regression. Data from all 76 subjects are used for the analysis. The slopes of the trend with 95% confidence interval between mean whole-brain standard deviation and mean FD or rmsFD are listed in the figure.

