
Figure 3.
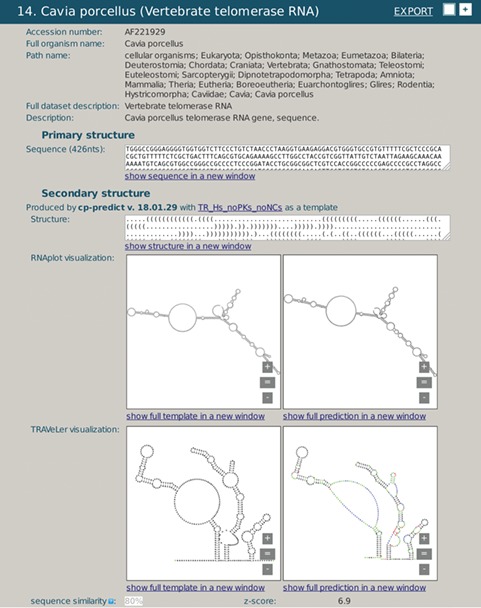
A snapshot of rPredictorDB output for C. porcelanus TR RNA. Panels (a) and (c) show secondary structure of a template (H. sapiens TR RNA) displayed by RNAplot and Traveler, respectively. Panels (b) and (d) show secondary structure of C. porcelanus TR predicted using H. sapiens TR RNA as a template, displayed by RNAplot and Traveler, respectively.