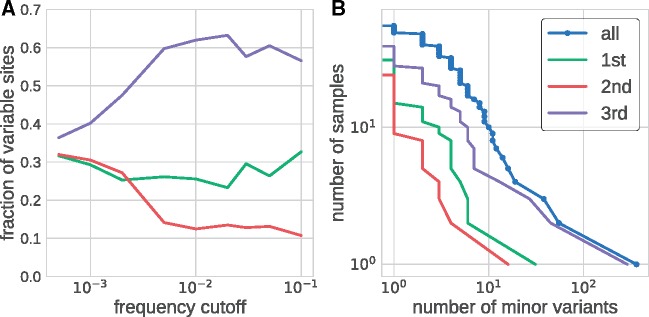
Figure 3.
Within sample diversity. Panel (A) shows the distribution of the number of variable sites in coding regions among different coding positions. At very low-frequency cutoffs, variable sites are approximately equally distributed in codons. The distribution rapidly changes once the frequency cutoff exceeds 0.3 per cent, beyond which variable sites are found predominantly at third codon positions and more rarely at first and second codon positions. Panel (B) shows inverse cumulative distribution of the number of samples that have more than a certain number of sites that are variable above a level of 3 per cent. Separate distributions are shown for all sites and for first, second, and third codon position in the coding region of the genome.

