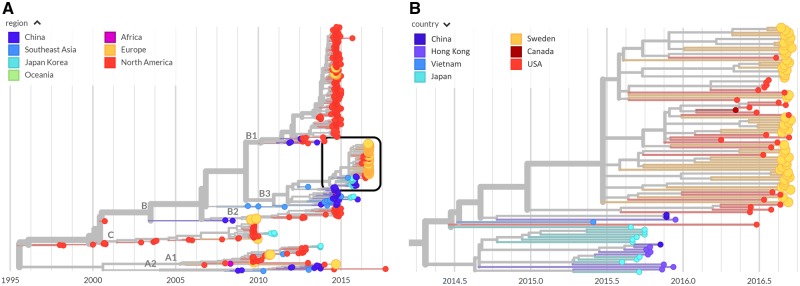
Figure 6.
Phylogenetic analysis. The left panel shows a phylogenetic tree as rendered by nextstrain with the sequences labeled by region. Those from Europe, including those from Sweden, are colored in orange. The right panel is a zoomed-in view of the boxed area on the left-hand panel colored by country and highlighting the Swedish sequences from the 2016 outbreak (orange). Swedish sequences often cluster together, but are interspersed with sequences from Canada (dark red) and the USA (red), implying multiple introductions that then spread locally.

