Figure 7.

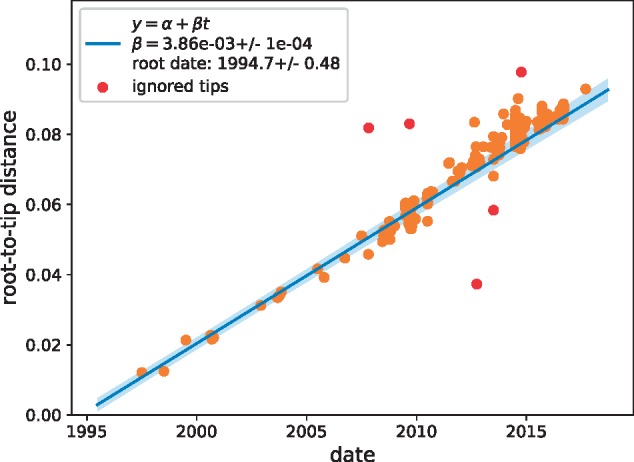
Temporal signal. A scatter plot of root-to-tip distance vs. time indicates an extremely strong temporal signal with an evolutionary rate of μ = 0.0039 ± 0.0001 substitutions per site and year.

Temporal signal. A scatter plot of root-to-tip distance vs. time indicates an extremely strong temporal signal with an evolutionary rate of μ = 0.0039 ± 0.0001 substitutions per site and year.