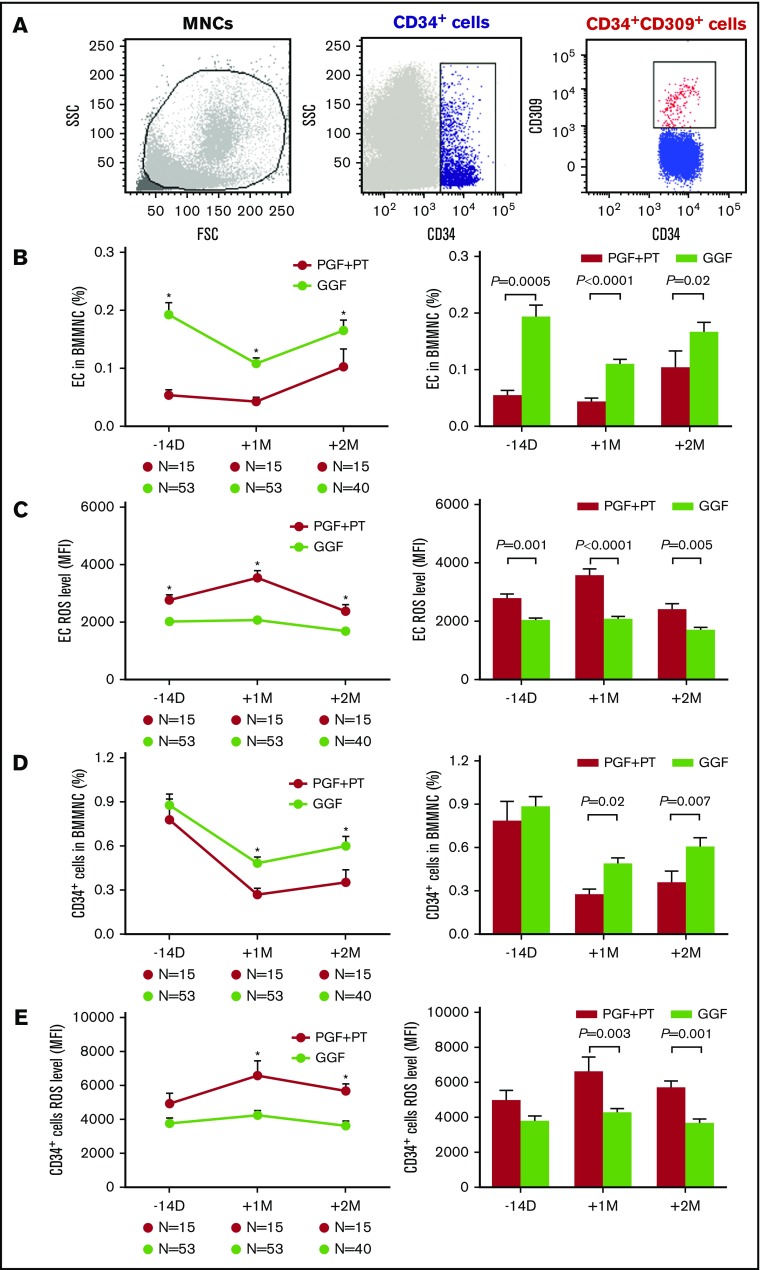
Figure 1.
PGF and PT patients demonstrated defective BM ECs pre-HSCT and impaired dynamic reconstitution of BM ECs and CD34+cells at early time points post-HSCT. Dynamic reconstitution (left panel) and statistical analysis (right panel) of BM in the first clinical trial. Representative image of ECs demonstrated by flow cytometry (A), EC percentages (B), EC ROS levels (C), CD34+ cell percentages (D), and CD34+ cell ROS levels (E) analyzed by flow cytometry in PGF, PT, and GGF patients at −14 days pre-HSCT and +1 month and +2 months post-HSCT. The data are expressed as the mean and standard error of the mean (SEM). Statistical analyses were performed using 1-way ANOVA for comparisons among the groups. Subject variables were compared using the χ2 test for categorical variables and the Mann-Whitney U test for continuous variables. P < .05 was considered statistically significant and is provided in the figure. *P < .05. FSC, forward scatter; MFI, mean fluorescence intensity; MNC, mononuclear cell; SSC, side scatter.

