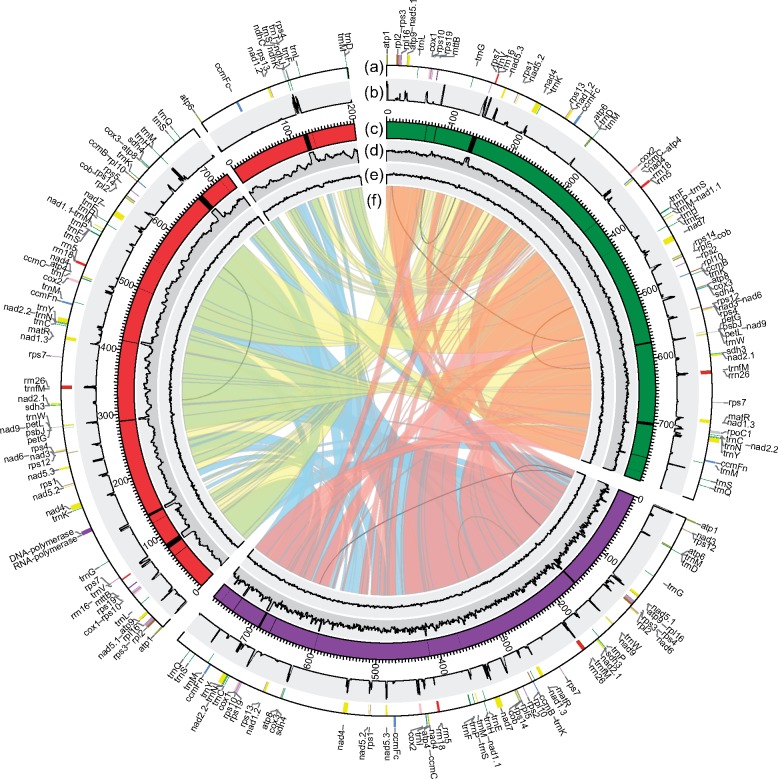
Fig. 1.
—Circular diagram showing the information on kiwifruit mitogenomes. The Actinidia chinensis (red), Actinidia eriantha (purple) and Actinidia arguta (green) mitogenomes are circular but are shown here as linear starting from the atp1 gene (from the atp6 gene in the small chromosome of Actinidia chinensis). (a) Gene blocks shown on the outside and inside the circle were transcribed clockwise and counter clockwise, respectively. Genes from the same complex are similarly colored. (b) RNA-Seq depth ratio* supporting the annotated protein-coding genes. (c) Plastid-derived fragments characterized by the black blocks inlaid in the karyotypes. (d) DNA-Seq depth ratio* supporting the assemblies and identified plastid-derived regions. (e) The GC content in 1,000-bp windows. (f) The colored bands in the center show links between syntenic blocks among the three mitogenomes. The inner repeats in each mitogenome (>300 bp) are represented by black lines. *The depth ratio = average depth in 100-bp windows/average total depth.

