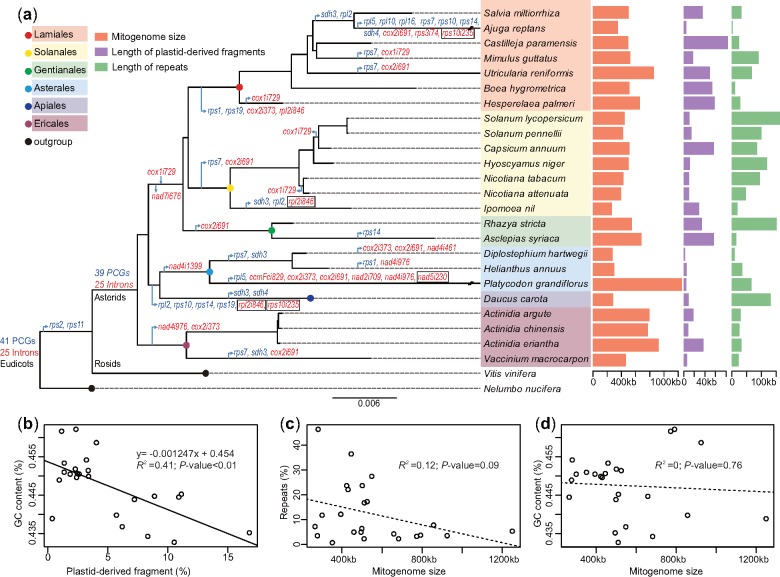
Fig. 4.
—The comparative analysis of asterid mitogenomes. (a) The phylogenetic distribution of genes and introns and genomic features of asterid mitogenomes. The phylogenetic tree of asterids was constructed based on the concatenated coding regions of 24 core protein-coding genes (PCGs) with Vitis vinifera and Nelumbo nucifera as outgroups. Genes and introns are presented in red and blue, respectively. The arrow represents the loss or gain of a gene or intron from the corresponding clade. The framed introns are those in which their absence accompanied the loss of the corresponding gene. (b–d) The linear regression analysis between GC content and length of plastid-derived fragment, between mitogenome size and length of repeats, and between GC content and mitogenome size, respectively.

