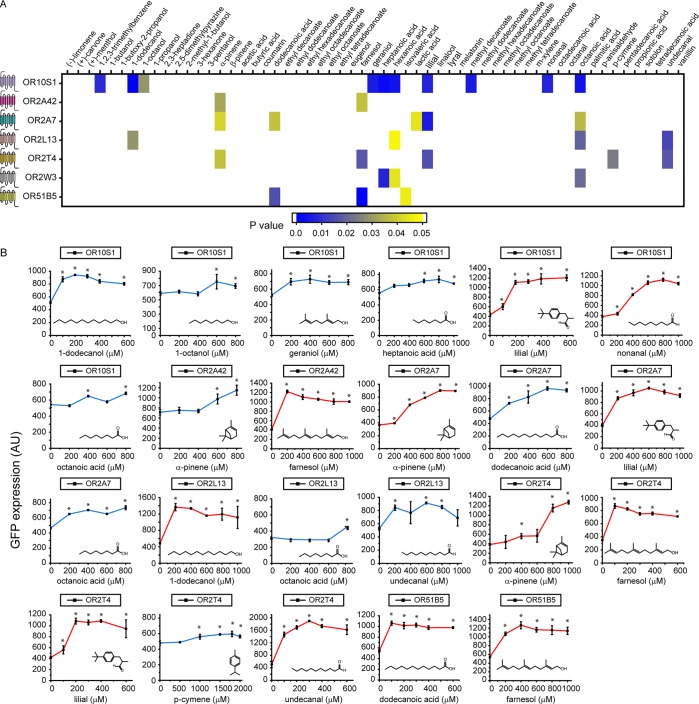
Figure 2.
Rapid deorphanization of human olfactory receptors (ORs). (A) Heat map of p values of chemicals leading to a statistically significant increase in the level of GFP expression when compared to the dimethyl sulfoxide (DMSO) control (p < 0.05). (B) Dose–response curves of ORs with 23 chemical hits. Blue curves are for chemicals leading to a statistically significant increase in the intensity of the signal after activation. Red curves are for chemicals resulting in a >2-fold increase in the intensity of the signal after activation. Asterisks denote statistically significant increases (p < 0.05) in the intensity of the signal after activation when compared to no chemical. Figure S2 shows dose–response curves of the nine OR/chemical pairs that did not result in a statistically larger increase in the intensity of the signal after activation. All measurements were carried out in triplicate, and means ± the standard deviation are shown.

