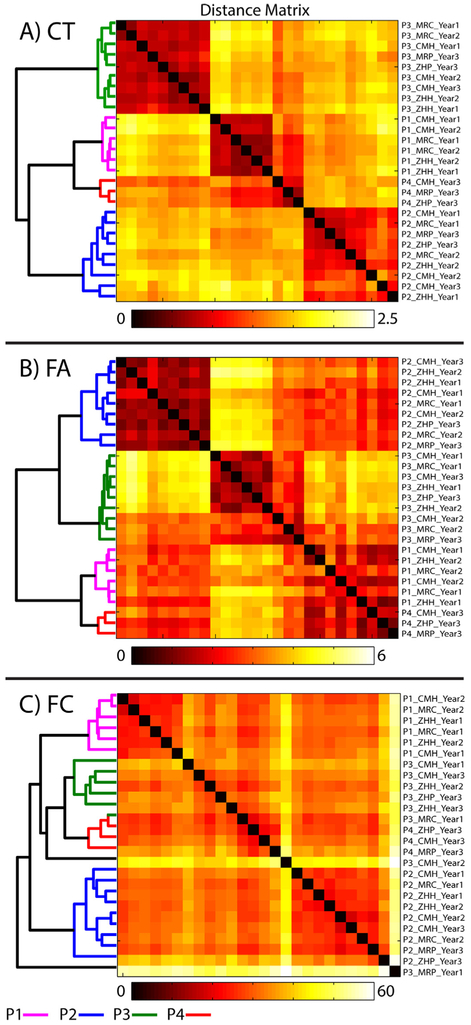
Fig. 2.
Results of the hierarchical clustering analysis for: A) cortical thickness (CT); B) fractional anisotropy (FA); C) functional connectivity (FC). The distance matrix shows Euclidean distances between scans (defined as the sum of the squared difference between each ROI for each pair of scans, such that lower distances between scans mean they are more similar). The cluster tree (dendrogram) is shown on the left. Color coding on the dendrogram represents participant ID. Participant ID, scanner, and year for each scan in the distance matrix is shown on the right.

