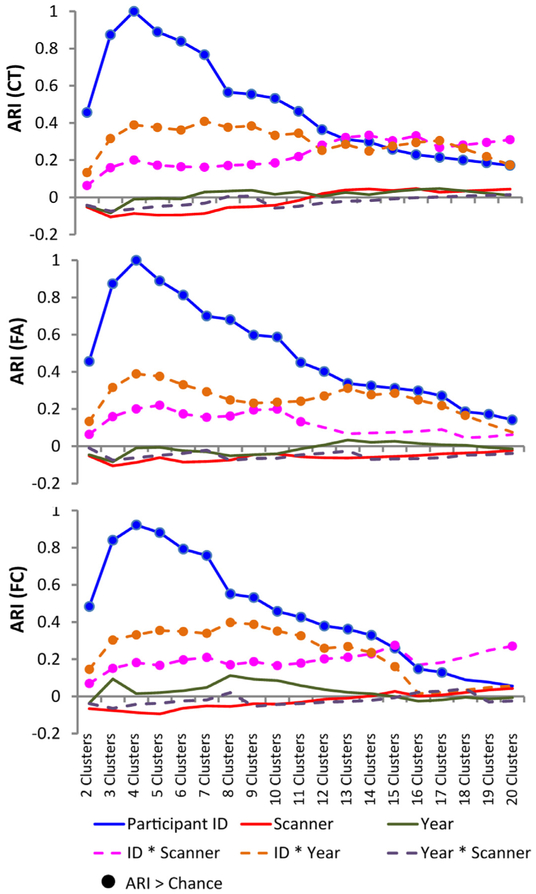
Fig. 3.
Cluster solutions for cortical thickness (CT; top), fractional anisotropy (FA; middle) and functional connectivity (FC; bottom) for cluster solutions ranging from two to 20 clusters. An analysis was conducted to establish if a given cluster solution was related to the participant ID or scanner. Year was included as a ‘control’ variable. An adjusted Rand index (ARI) was calculated for each cluster solution and scan-related variables, namely participant ID (4 labels; P1, P2, P3, P4), scanner (5 labels; CMH, MRC, MRP, ZHH, ZHP), year (3 labels; Year1, year2, year3), a combination of ID by scan site (16 labels; e.g. P1 at CMH, P1 at MRC, etc.), ID by year (9 labels; e.g. P1 during Year1, P1 during year2, etc.), and year by scanner (9 labels, e.g. CMH at Year1, CMH at year2, etc.). Circles/dots indicate ARI values which are above chance as determined via a null distribution created using a permutation test, suggesting greater than chance overlap between that label and the cluster solution.

