
Figure 2. Fc-biophysical antibody binding profiles accurately predict protection across immunogens and routes of administration.
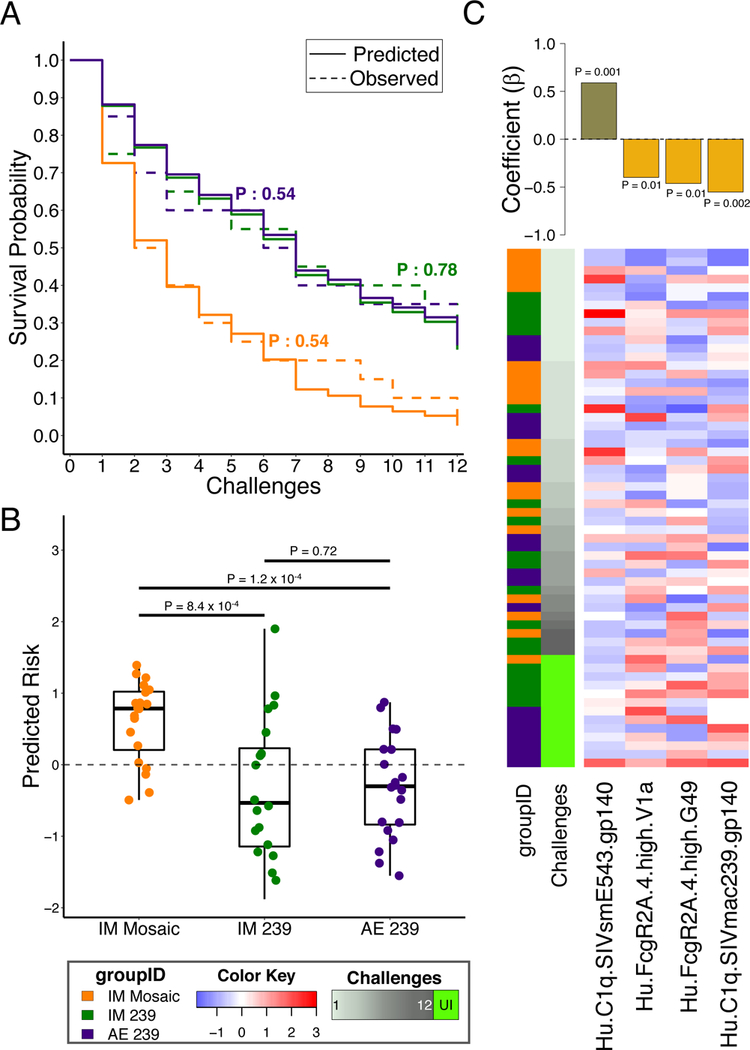
(A) The predicted infection probabilities in the final Cox Proportional Hazards (PH) model closely match observed Kaplan-Meier curves for each of the three Env-immunized study arms (n = 20 animals in each of three arms; P-values: two-sided log-rank test). (B) Animals in the IM mosaic arm have significantly higher predicted risk of infection than those in the other arms in the representative cross-validation run (n = 20 animals in each of three arms; P-values: two-sided Wilcoxon-Mann-Whitney). Boxplots depict the median and interquartile range. (C) Heatmap and feature coefficient plot of the humoral response features (columns) contributing to the final model (coefficients in bars), with one predictive of risk and three of protection (P-values: Cox PH). The animals (rows, n = 60) are ordered in ascending order of time-to-infection. Centered and scaled antibody feature values are presented in heatmap form, with high responses indicated in red and low responses in blue.