
Fig. 7.
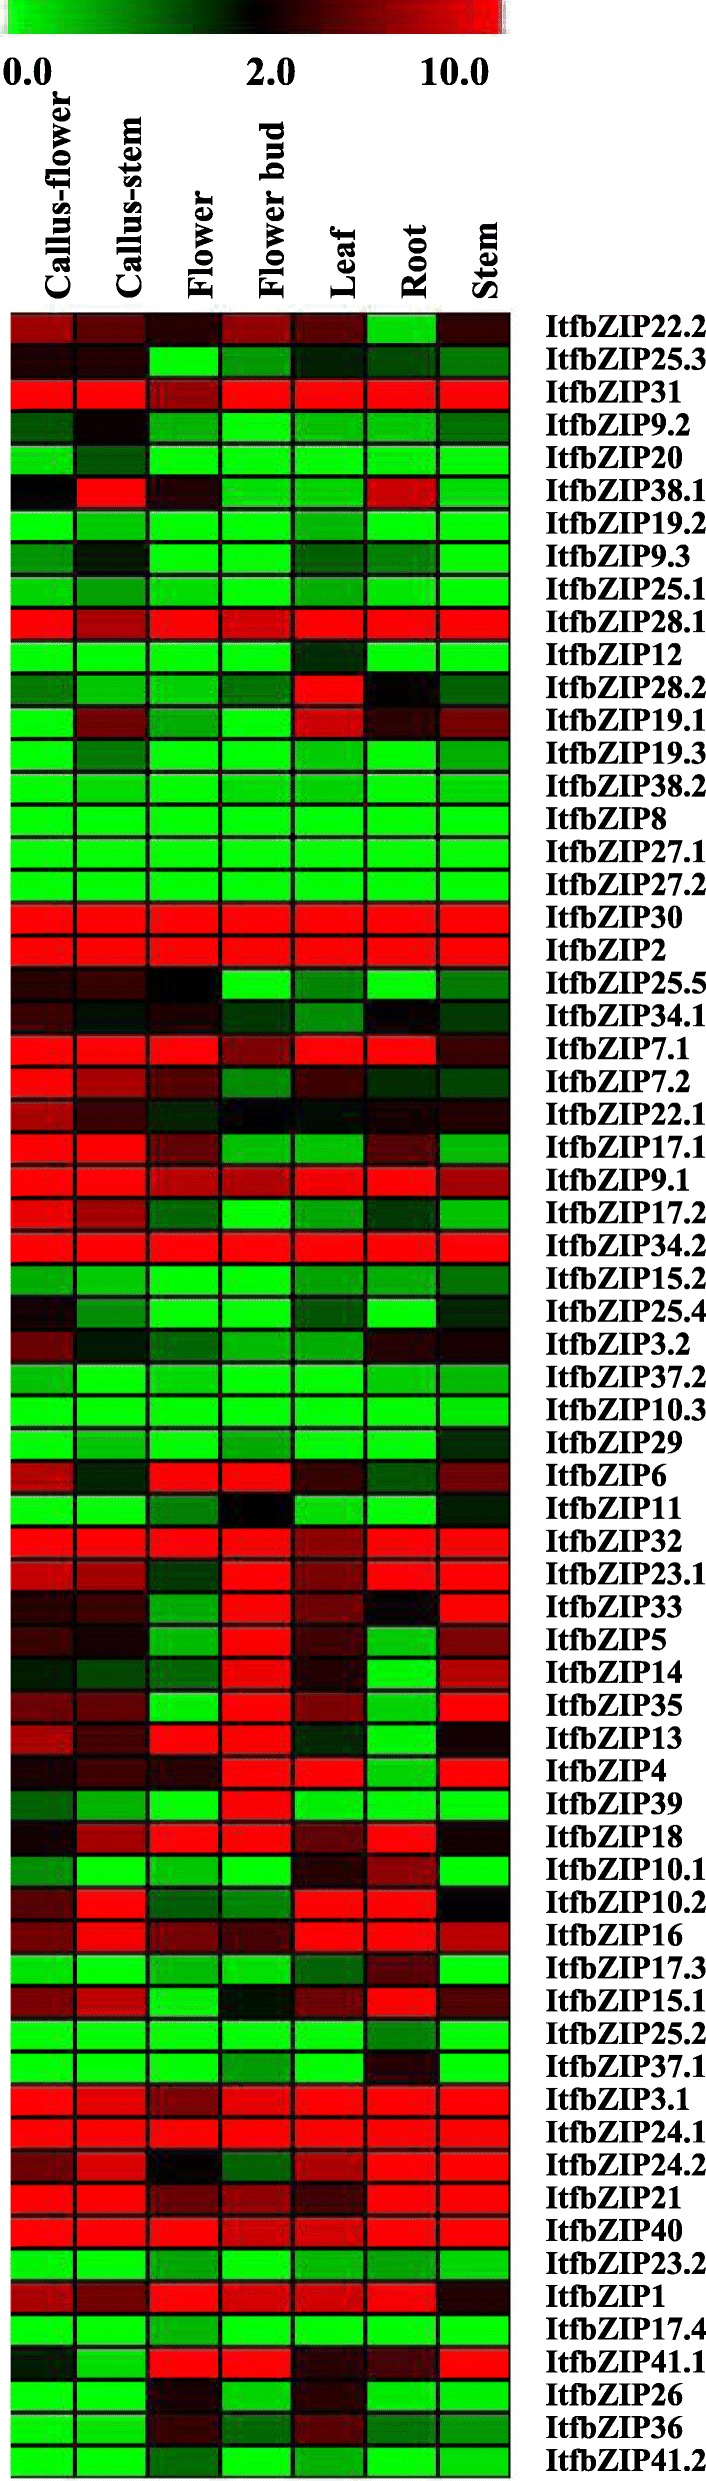
Relative expression levels of ItfbZIP genes across various tissues. A heat map with clustering is created based on the FPKM value of ItfbZIPs. The coloured scale varies from green to red, indicating relatively low or high expression
Official websites use .gov
A
.gov website belongs to an official
government organization in the United States.
Secure .gov websites use HTTPS
A lock (
) or https:// means you've safely
connected to the .gov website. Share sensitive
information only on official, secure websites.
Relative expression levels of ItfbZIP genes across various tissues. A heat map with clustering is created based on the FPKM value of ItfbZIPs. The coloured scale varies from green to red, indicating relatively low or high expression