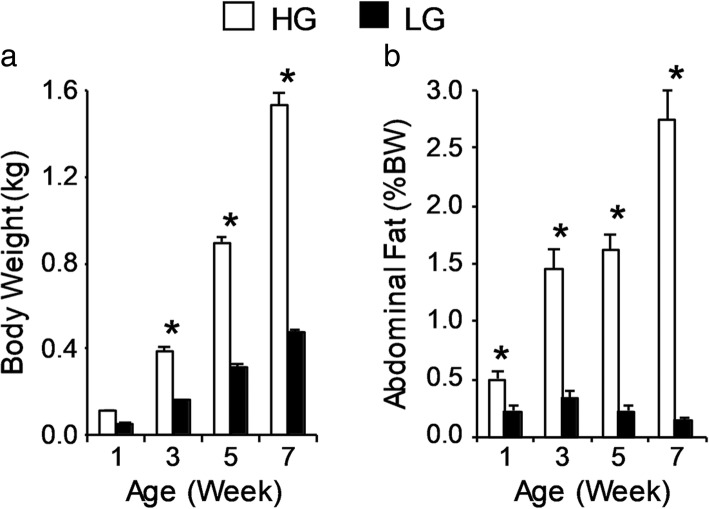
Fig. 1.
Phenotypic characterization of juvenile male HG and LG chickens. a Body weight (BW, kg; top) and b abdominal fat (% BW; bottom) of birds from each line at post-hatch weeks 1, 3, 5, and 7 (n = 8 birds per line). Values are expressed as mean ± SEM. When the two-way ANOVA demonstrated a significant line-by-age interaction (P ≤ 0.05), the presence of an asterisk (*) denotes a significant difference between the lines at the indicated age (P ≤ 0.05). Data included in this figure have been previously published in (21)

