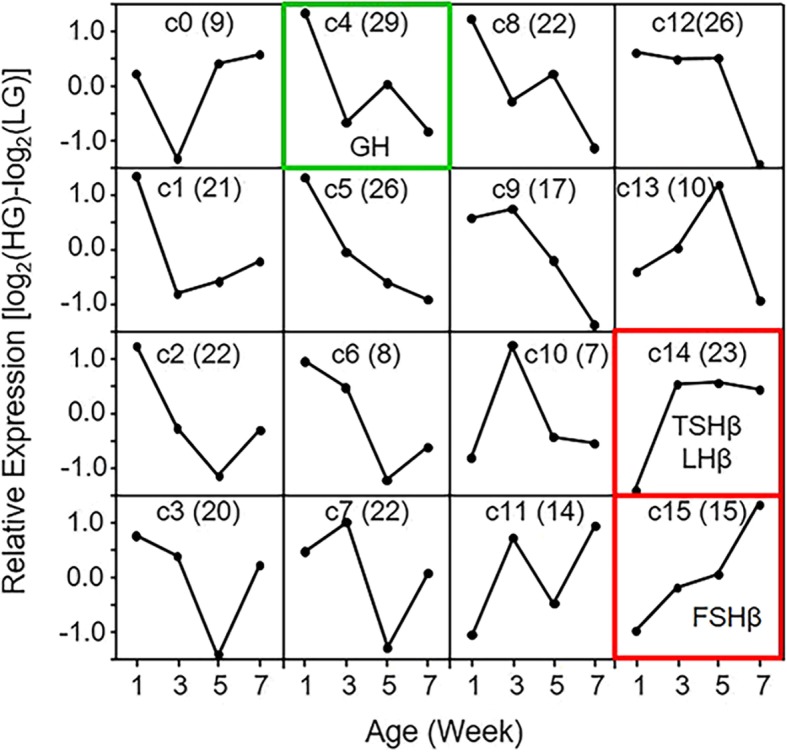
Fig. 4.

Self-organizing maps (SOMs) analysis of DEGs in the anterior pituitary of HG and LG chickens. Genes with a significant line-by-age interaction or a significant main effect of line (P ≤ 0.05; n = 4 birds per line) as determined by two-way ANOVA and a difference in expression of at least 1.6-fold between HG and LG lines (291 total) were organized into 16 clusters (c0-c15) in a 4 × 4 configuration. Data were organized into clusters as mean log2-ratio of HG – mean log2-ratio of LG. The number of genes contained within each cluster is indicated in parentheses at the top center of each cluster. Examples of important genes upregulated in LG chickens (green) or HG chickens (red) are identified in c4 (GH), c14 (TSHβ and LHβ) and c15 (FSHβ)
