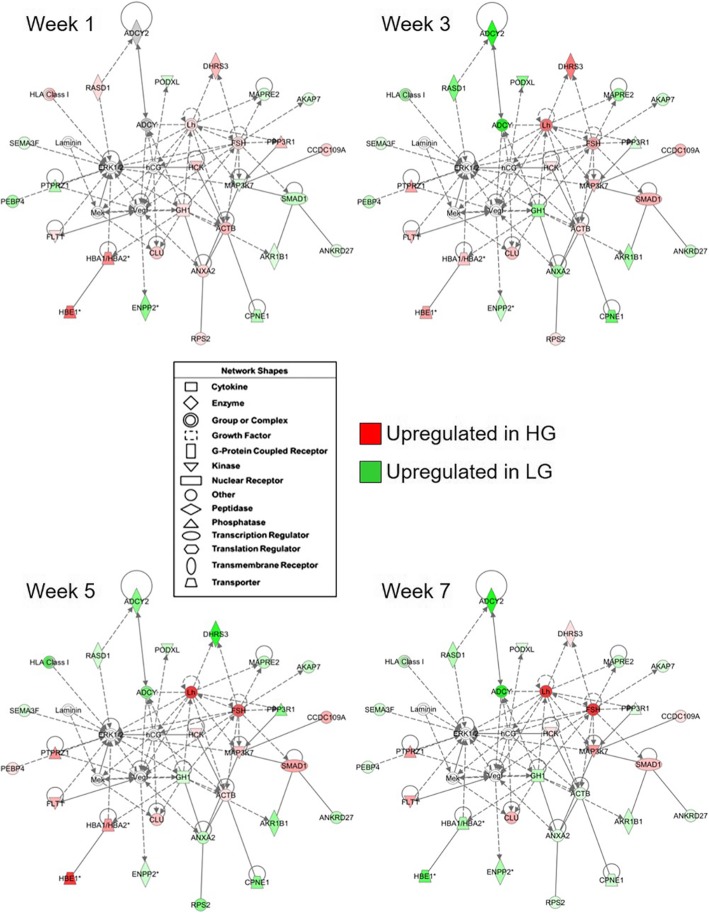
Fig. 6.
Functional gene interaction network associated with pituitary hormone production in HG and LG chickens. A gene network showing direct (solid lines) and indirect (dashed lines) relationships associated with “Molecular Transport” was identified using Ingenuity Pathway Analysis software. Genes which are colored red (upregulated in HG line) or green (upregulated in LG line) are contained within the dataset of 291 genes with a significant line-by-age interaction or a significant main effect of line (P ≤ 0.05; n = 4 birds per line) and a difference in expression of at least 1.6-fold between lines. The intensity of the red or green colored gene symbols indicates the magnitude of the difference between genetic lines. The legend indicates the functional type of each gene

