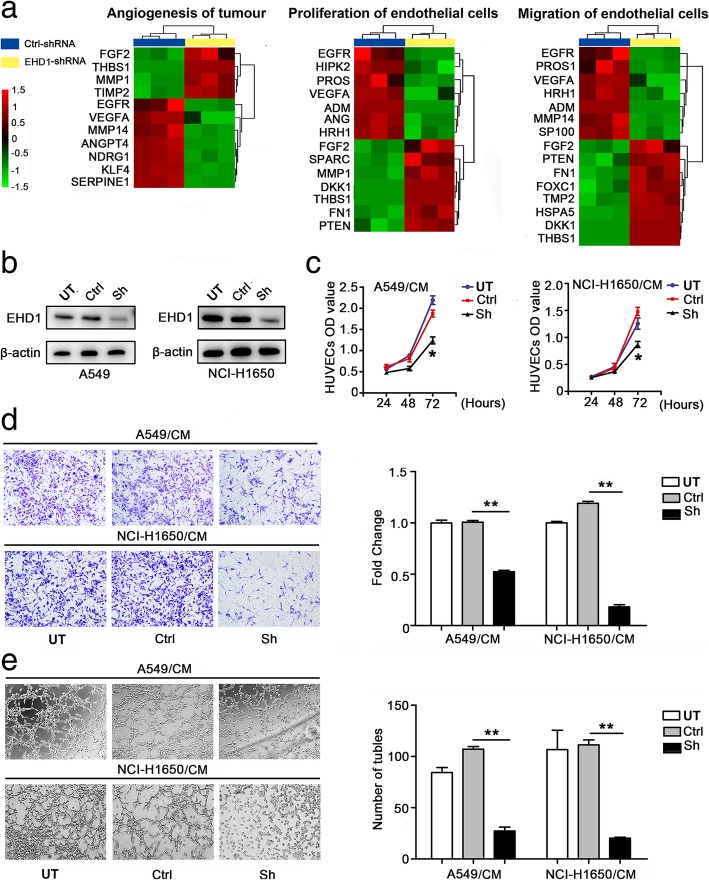
Fig. 1.
EHD1 induces angiogenesis in NSCLC. a Microarray analysis demonstrating the positive correlation between EHD1 and tumour angiogenesis and vascular endothelial cell proliferation and migration. The pseudocolor represents the intensity scale for the EHD1 ShRNA vector versus the control, as calculated by log2 transformation. b Western blot analysis of EHD1 expression in A549 and NCI-H1650 cells after EHD1 knockdown. β-actin served as the loading control. c The viability of HUVECs was detected by CCK8 assay. HUVECs were incubated in 96-well plates with CMs from A549 and NCI-H1650 cells. d CMs were added to the lower chamber, and HUVECs were seeded on the upper chamber. After 24 h of incubation, HUVEC migration was assessed by counting the cells on the lower surface of the membrane; from left to right, the lanes show UT, Ctrl and ShEHD1. Scale bar, 100 μm. e HUVECs were incubated in 48-well plates with CMs from A549 and NCI-H1650 cells, and their tube formation was evaluated based on the number of tubes per field. *p < 0.05; **p < 0.01

