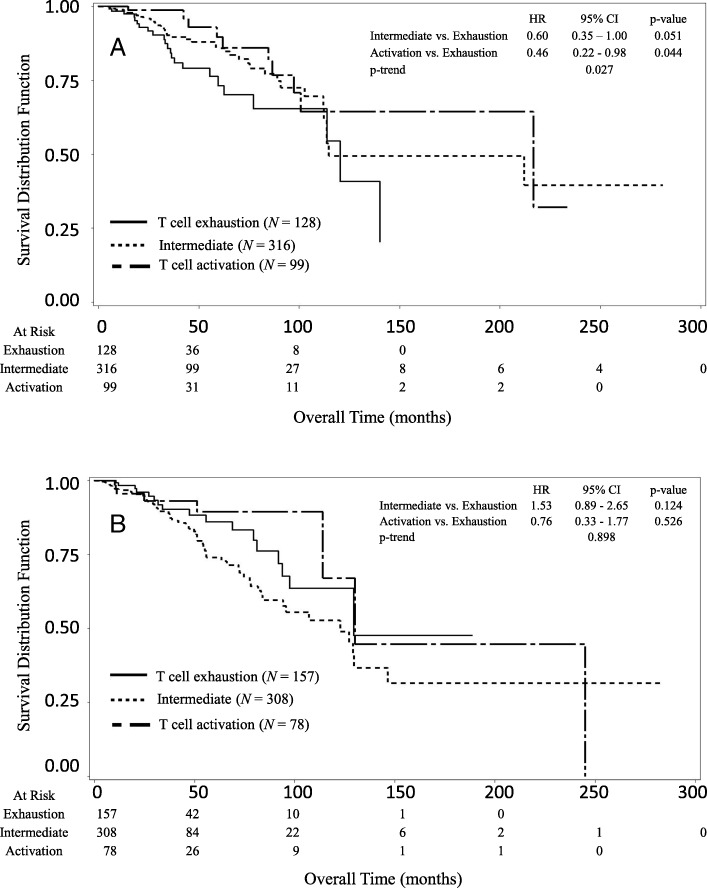
Fig. 1.
Kaplan-Meier survival curves of breast cancer patients stratified by the T cell activation status (score). a In the subgroup with a low BRCA1 expression level, patients in the Activation group had better overall survival compared to those in the Exhaustion group (p-trend = 0.027). b In the subgroup with a high BRCA1 expression level, there were no significant difference in overall survival between patients in the Activation and Exhaustion groups (p-trend =0.898)

