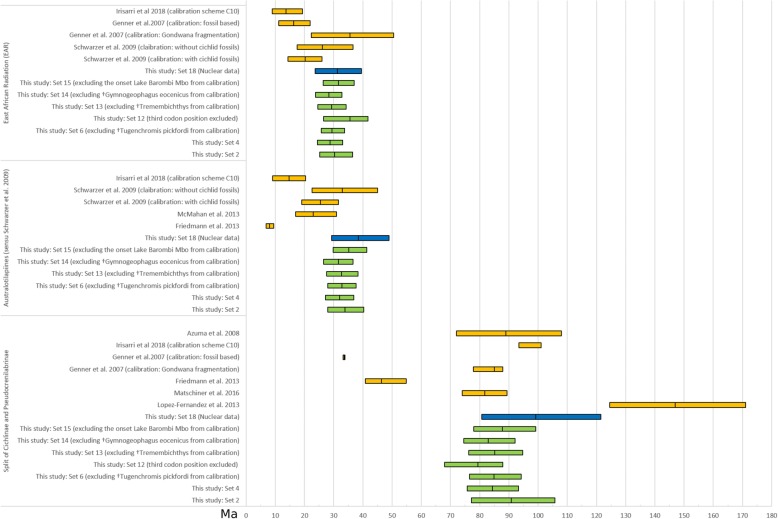
Fig. 3.
Overview of divergence age estimates from this study. Calibration Sets based on the mitochondrial dataset (Set 2, Set 4, Set 12, Set 13, Set 14 and Set 15) are depicted in green. Calibration Set 18 based on the nuclear dataset is depicted in blue and several previous studies for selected cichlid groups (Cichlinae and Pseudocrenilabrinae, austrotilapiines and the East African Radiation) are depicted in orange. Depicted are either 95% HPD (highest posterior intervals), 95% credibility intervals, 95% confidence intervals or standard deviations depending on the source study. Mean ages are indicated by middle bar of each interval

