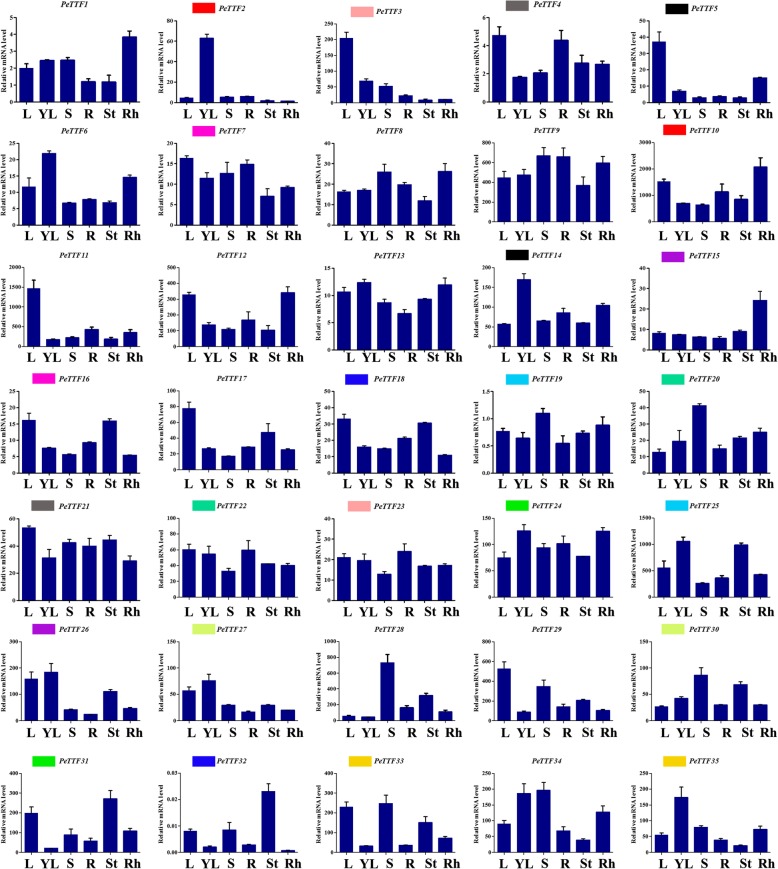
Fig. 6.
Expression profiles of poplar TTF genes across different tissues and developmental stages as revealed by qRT-PCR. Y-axis: relative expression levels; X-axis: the time course of stress treatments; Error bars, 6 ± SE. The abbreviation represents specific developmental stages: leaf (L); young leaf (YL); root (R); rhizome (RH); shoot (S); stem (St)

