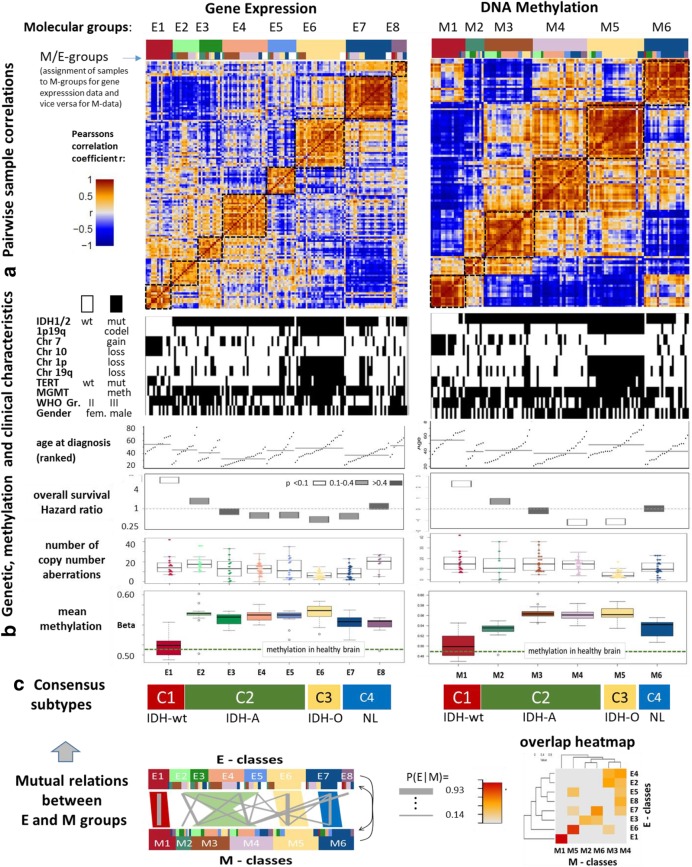
Fig. 1.
Characteristics of molecular subtypes of glioma. Samples were grouped into gene expression groups E1 – E8 (E-classes) or DNA methylation groups M1 – M6 (M-classes) using the sample expression and methylation data, respectively. A) The pairwise sample correlation heatmaps visualize the correlation coefficient between all pairwise combinations of sample-portraits. Intra-class similarities between samples are evident as brown quadratic areas along the diagonal while inter-class relations are seen either as brown or blue off-diagonal regions for positively and negatively correlated data landscapes, respectively. B) Genetic, methylation and clinical characteristics (see text). C) We sorted samples in each E-group according to their M-group membership and in each M-group according to their E-group membership to better recognize pattern due to methylation and expression effects, respectively (see the two color bars above the heatmap). The color code for molecular groups are used throughout the paper. Mutual relations between the E- and M-groups were estimated based on mutual memberships of the samples giving rise to four consensus subtypes C1- C4 which are characterized by IDH-wild type astrocytoma-like (IDH-wt), IDH-mutated astrocytoma-like (IDH-A) and oligodendroglioma-like (IDH-O) and a neuronal-like (NL) phenotypes, respectively

