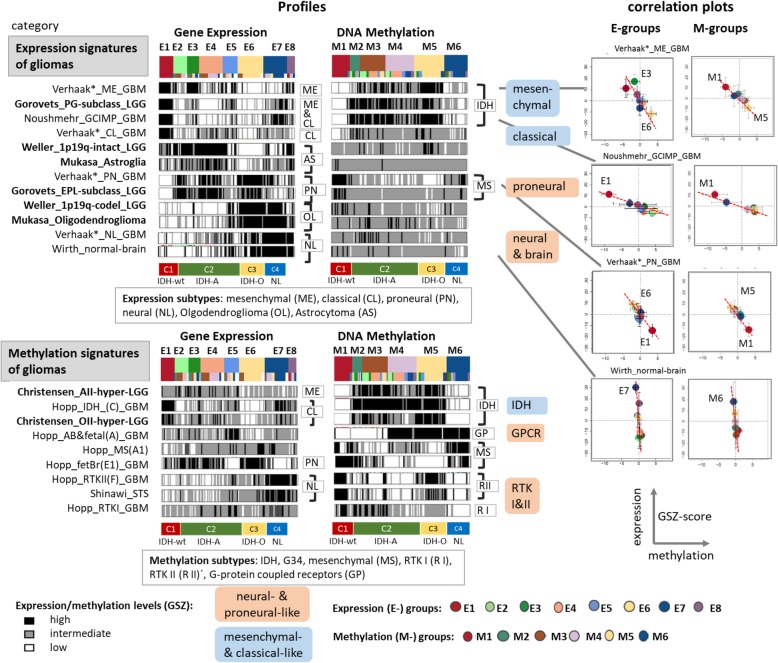
Fig. 2.
Gene set analysis associates the E- and M-subtypes with previous glioma expression and methylation signatures (see Additional file 1: Table S6 for details). The expression and methylation levels of the signature sets are shown as bar-code profiles where each bar refers to one sample. Correlation plots between expression and methylation levels in GSZ-scale reflect predominantly repressive effects of promoter methylation on the expression of the downstream genes (right part)

