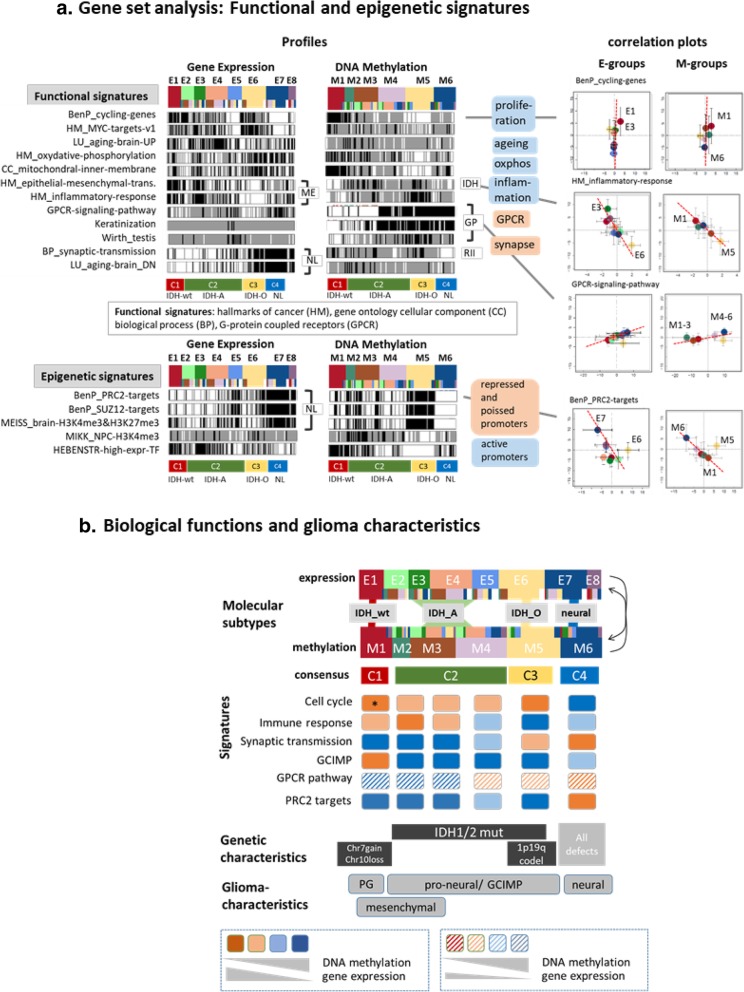
Fig. 3.
Gene set analysis of functional and epigenetic signatures: a Bar-code profiles of expression and methylation levels of functional and epigenetic signatures and the correlation plots of subtype averaged values (see legend of Fig. 2). b Schematic overview about the basic functional, genetic and glioma characteristics extracted from the gene-signature analysis

