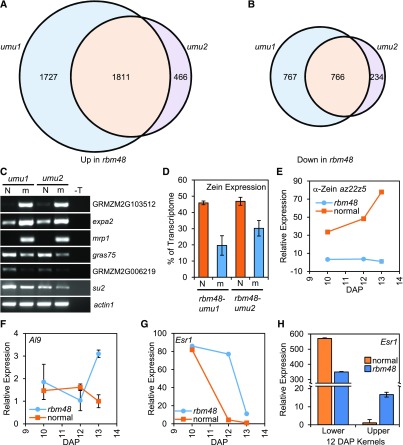
Figure 6.
Expression Defects in rbm48.
(A) and (B) Venn diagrams showing the overlap of up- (A) and down-regulated (B) DEGs in rbm48-umu1 and rbm48-umu2.
(C) RT-PCR of normal (N) and rbm48 mutant (m) endosperm RNA used for RNA-seq. GRMZM2G103512, expa2, and mrp1 were predicted to have increased levels in rbm48 mutants, while gras75, GRMZM2G006219, and su2 were predicted to show decreased expression in rbm48. The actin1 locus was used as a loading control. T is a no cDNA template negative control. Gene names are MaizeGDB locus identifiers.
(D) Proportion of total transcriptome represented by 39 zein transcripts based on endosperm RNA-seq. Error bars are sd of four biological replicates.
(E) to (G) RT-qPCR of total RNA extracted from whole kernels in rbm48 and normal siblings for α-Zein (E), Al9 (F), and Esr1 (G). Error bars are sd of three biological replicates.
(H) RT-qPCR of Esr1 expression in total RNA extracted from lower and upper half kernels. Error bars are sd of three biological replicates.

