Figure 6.
PtrAREB1-2 Interacts with the HAT Complex PtrADA2b-3:PtrGCN5-1.
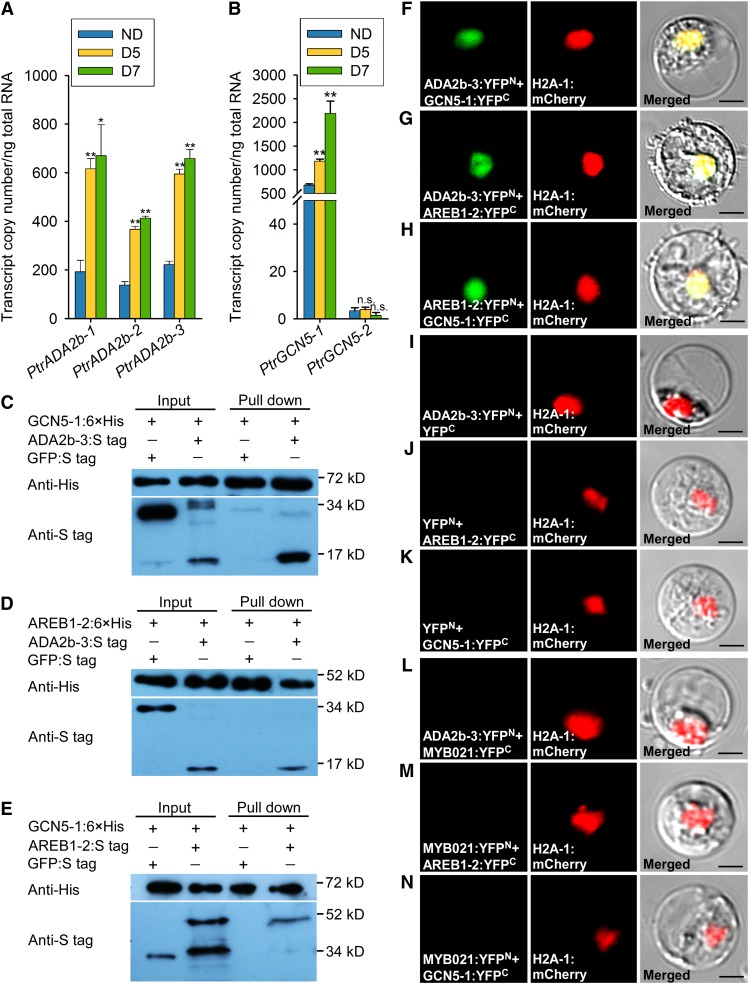
(A) and (B) Abundance of alternatively spliced transcripts of PtrADA2b-1, PtrADA2b-2, and PtrADA2b-3 (A) as well as PtrGCN5-1 and PtrGCN5-2 (B) determined by RT-qPCR in the xylem of P. trichocarpa under well-watered and drought conditions. Error bars indicate 1 se of three biological replicates in (A) and six biological replicates in (B) from independent pools of P. trichocarpa SDX tissues. Asterisks indicate significant differences between control (ND) and drought-treated (D5 and D7) samples for each gene (*, P < 0.05 and **, P < 0.01, Student’s t test), and n.s. denotes no significant difference.
(C) to (E) Interactions of PtrADA2b-3, PtrGCN5-1, and PtrAREB1-2 with each other determined by pull-down assays. His-tagged PtrGCN5-1 and PtrAREB1-2 as well as S-tagged PtrADA2b-3 and PtrAREB1-2 purified from E. coli were used for pull-down assays, and GFP was used as a negative control.
(F) to (N) BiFC assays in P. trichocarpa SDX protoplasts showing that PtrADA2b-3, PtrGCN5-1, and PtrAREB1-2 proteins interact with each other in the nucleus ([F] to [H]). Cotransfection of each protein of interest with an empty plasmid served as a control ([I] to [K]). PtrMYB021, an unrelated TF expressed in the nucleus (Li et al., 2012), was used as another negative control ([L] to [N]). Neither negative control gave any YFP signal. Green shows the YFP signals from protein interaction, red indicates the nuclear marker H2A-1:mCherry, and yellow represents the merged signals from YFP and mCherry. Images from two other biological replicates are shown in Supplemental Figure 13. Bars = 10 µm.

