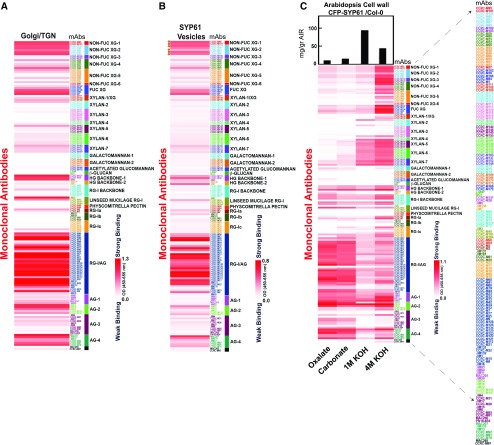
Figure 3.
Glycome Profiles of TGN, Isolated SYP61 Vesicles, and CFP-SYP61 Cell Walls.
(A) to (C) Interrogation of CFP-SYP61 Golgi/TGN (A), isolated CFP-SYP61 vesicles (B), and Arabidopsis CFP-SYP61 seedling cell walls (C) with 155 plant cell wall glycan-directed mAbs.The mean of three biological replicates is shown.
Data in (B) represent differential heatmaps, with background from all negative control vesicles subtracted to demonstrate polysaccharide enrichment in vesicles. Galactosylated XyG epitopes (XLXG, XXLG, and XLLG) recognized by the mAbs CCRC-M87, CCRC-M88, CCRC-M93, CCRC-M95, CCRC-M101, and CCRC-M104 are indicated by circles. Statistical significance of each Ab binding compared with all the negative controls is shown in Supplemental Data Set 3.
(C) Glycome profiling of CFP-SYP61 seedling cell walls. Sequentially extracted cell wall material derived from wild type Col-0 plants expressing CFP-SYP61 was analyzed using glycome profiling with the glycan-directed mAbs. Bars at the top indicate milligrams per gram of cell wall AIR. In each lane, 0.3 µg of Glc equivalent amounts of polysaccharides was applied. Labels at the bottom specify the different fractions assayed. Accompanied data are presented in Supplemental Data Set 4.
White-to-red scales indicate signal intensity in the ELISAs, with white corresponding to no binding and red to strong binding. Enlarge on screen to view mAbs IDs within each Ab cluster.The list of mAbs is enlarged to the right.

